
Consumer prices in November fell ( - 1.9%) non-seasonally adjusted. The YoY rate of inflation is now only 1.1%. In the last 4 months, prices have fallen ( - 3.4%), or at an annual rate of ( - 13.2%). I am accordingly updating my table of Deflationary Recessions:
Recession dates/ YoY, monthly deflation/greatest +/- change
| Recession Time Period | -1.5% Deflation | Largest Change |
|---|---|---|
| 1/13 - 12/14 | 2 - 4/14 | (-3.0%) |
| 8/18 - 3/19 | n/a (inflationary) | +23.7% |
| 1/20 - 7/21 | 8/20 - 9/22 | (-15.8%) |
| 5/23 - 7/24 | 4/24 | (-1.8%) |
| 10/26 - 11/27 | 1 - 5, 8/27 | (-3.4%) |
| n/a | 6/28 | (-2.8%) |
| 8/29 - 3/33 | 4/29, 3/30 - 8/33 | (-10.7%) |
| 5/37 - 6/38 | 1 - 12/38 | (-3.4%) |
| 2/45 - 10/45 | n/a (inflationary) | +2.8% |
| 1/49 - 10/49 | 1/49 - 1/50 | (-3.2%) |
| 7/53 - 5/54 | n/a | (-.8%) | 12/07 - ???? | 10/08 - ???? | (-3.4%) |
We have now exceeded both of the post-WW 2 era deflations. While we aren't at Great Depression speed deflation (which over similar 4 month periods fell over ( - 7%) ), we are on par with the Recession of 1937-38 and several other periods. The only other period which exceeds our rate of deflation was the post WW1 recession of 1920-21.
Taking a closer look, we see that both Producer inflation (red) and crude goods inflation (orange) are falling at a faster rate than Consumer inflation, and also that Producer price inflation on a YoY basis is now less than Consumer inflation:
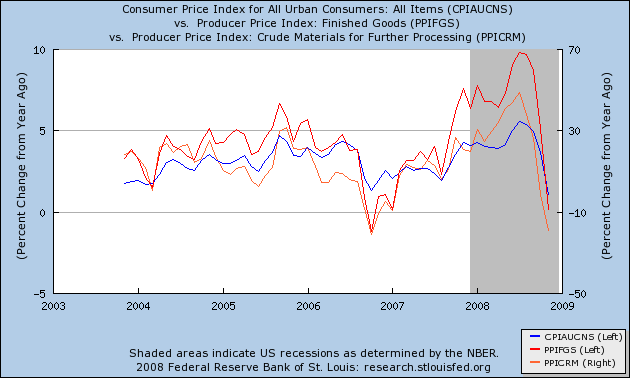
This was the normal pattern in all post-WW2 recessions, and signified that the recession was in its latter stage, or even was ending.
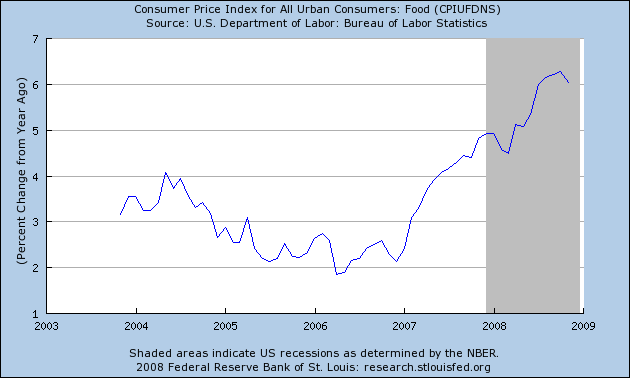
Many commentators were insisting that "it's different this time" and food price inflation would not abate. As of November, this is no longer true:
Finally, with the report on November inflation, I can now update the Kasriel indicator:
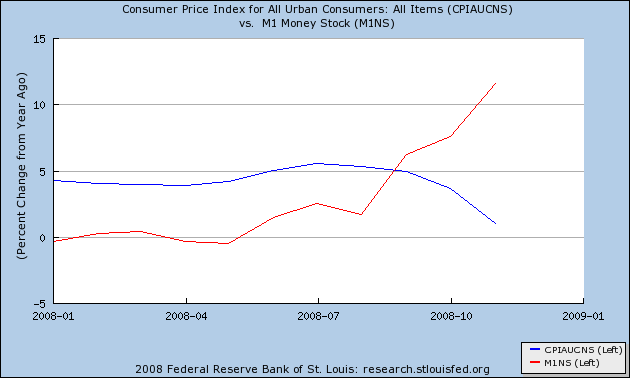
M1 money supply (red) has now exceeded the rate of inflation (blue) for 3 months in a row. In the post WW2 inflationary environment, this would trigger the Kasriel indicator indicator that a recovery was near. Let's just say that we are in a real-world laboratory experiment as to whether that is true of a deeply deflationary recession. I have some thoughts on this, as I have obtained a copy of Milton Friedman's classic work, "A Monetary History of the United States", which does have all of this data on a monthly basis for the WW1 era on. But I will hold off on posting about this until I can collate and accurately cite all of the data.
Comments
Real World lags Kasriel
I suspect that the numbers you're seeing are pre-indicators of a potential overreaction.
Such an overreaction could take 6-8 months to work it's way down to retail sales. Q1 prices will be deflationary, but Q2 or Q3 we're going to see hyperinflation to make it all back up and then some.
Or at least, that's my read.
Oh, and be wary of what we're reading as M1- if that isn't backed by anything other than 0% 4-week T-Bills, the hyperinflation will be followed by another, deeper crash.
-------------------------------------
Maximum jobs, not maximum profits.
what was going on 1920-1921?
as well as 1918? Is that a temporary shortage due to WWI and resulting "adjustment" back due to post war conditions?