
No, I have not lost my mind, although with a slew of just awful economic data for September and October spilling out, the title of this blog entry is a contrarian statement to say the least. What I mean is, measured by the indicators of past recessions going back all the way through the Great Depression, the shallow recession that I believe started approximately last December, and primarily affected Wall Street with only a glancing blow at Main Street, ought to be ending.
Almost a year ago, in November 2007 I said:
I suspect that the recent Fed cuts (and possibly one or two more) may cause the recession I think we are in now to be short and shallow. There will be a recovery late next year (but unemployment will lag through election day).
If these Fed rate cuts pour fuel on the inflation fire, then they'll have to reverse course and it may be right back into an even worse recession by 2009 (a similar pattern to the 1979 recession, 1980 inflationary recovery, 1981 recession).
I have fleshed out this idea in subsequent blogs, I have described the most reliable indicators of recession, two of which, combined, have been nearly infallible for 75 years. This is a variation of the proprietary "foolproof recession indicator" of Paul Kasriel, as modified by Mike Shedlock a/k/a Mish. The two indicators are, (1) a positively sloping yield curve, where you are paid more interest to hold bonds for a longer time than a shorter time, and (2) a money supply entering the economy that is growing faster than inflation. When both of these are negative, a recession has always ensued. When both are positive, a recession has never been in place. So strong are these two indicators that they also accurately coincide with the periods of recovery during the Great Depression itself.
Federal Reserve statistics always lag, and posting them graphically lags even more, but as of yesterday's CPI and Money supply data, both indicators are positive, indicating that by past experience the shallow recession of 2008 is ending.
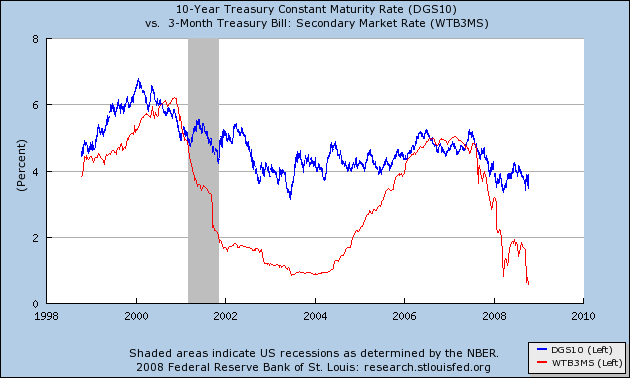
Let's look at two graphs describing these indicators as they exist now. First of all, the yield curve indicator: the yield on the 10 year bond (in blue) is substantially more than the yield on the 3 month treasury bill (in red). This is a strongly positive yield curve and in the era of post war inflation almost always indicated an economic expansion:
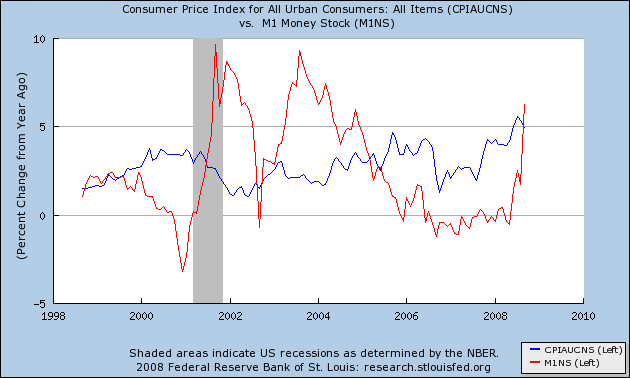
Secondly, "real" inflation adjusted money supply: the inflation rate, through September 2008, has declined to 4.9% year over year. The narrow money supply, M1, is indicated in dark red through August 1. While the data is subject to some revision, it appears almost certain that money supply grew at more than 5% during September. (Update: No sooner had I posted this blog than the Fed got around to updating their graphic information. M1 grew at a 6.1% rate in September. I have now updated the graph).
Thus both of the two typical conditions indicating an economic recovery are in place. By the end of September 2007 the yield curve was no longer inverted, although it was just barely becoming positive. The "real money supply" is also expansionary now, courtesy of the Federal Reserve turning on a fire house of liquidity aimed at the banking system. We are 3 months past the peak of the inflation rate at 5.6% in July. Typical recessions in the past have ended 2-6 months after the inflation rate began to decline.
Two other typical patterns I have noted in previous diaries have not yet fallen into place, although they only occur more often than not, not always.
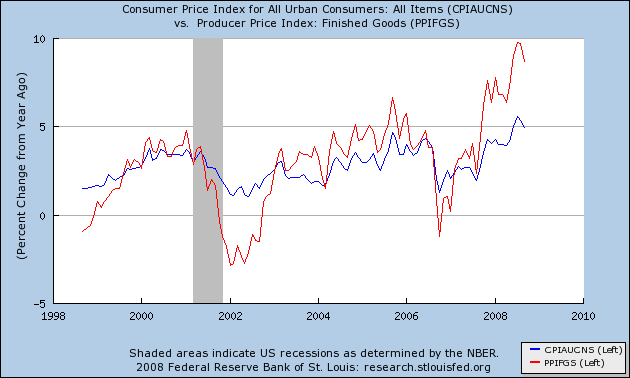
As I have set forth in several blogs before, typically during the first few months of a recession, inflation continues to increase, causing people to believe a stagflationary episiode is unfolding. Usually 3-6 months into a recession, but no later than 12 )in the 1974 recession), inflation peaks and then declines. Most often, but not always, producer price inflation is less than consumer inflation by the end of the recession, setting the stage for further business spending, profit, and recovery.
In our case, producer price inflation is still running about 4% higher than consumer inflation, although both are certainly declining. Note that a similar pattern occurred at the end of the 1974 and 1979 recessions.
The second is that food inflation is still increasing. Usually, food inflation peaks first, sometimes even before the recession actually begins. Only in the 2001 recession did food inflation continue to increase right up until the end of the recession. The same pattern is occurring now:
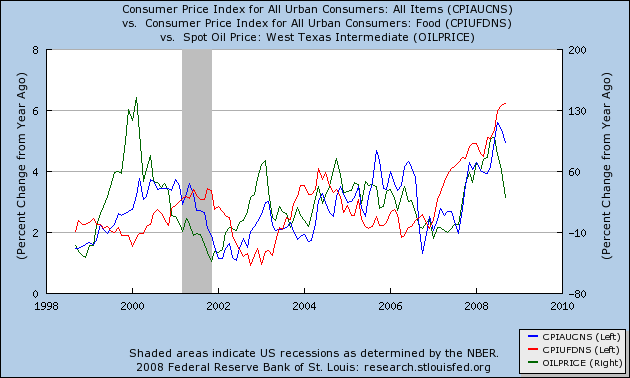
In prior blogs I have called for a "respite" to occur roughly around election day or the end of the year. In that regard, here is a graph of oil prices going back 3 years. Oil is now selling closer to $0 than to its high of $147,90 of only 3 1/2 months ago!
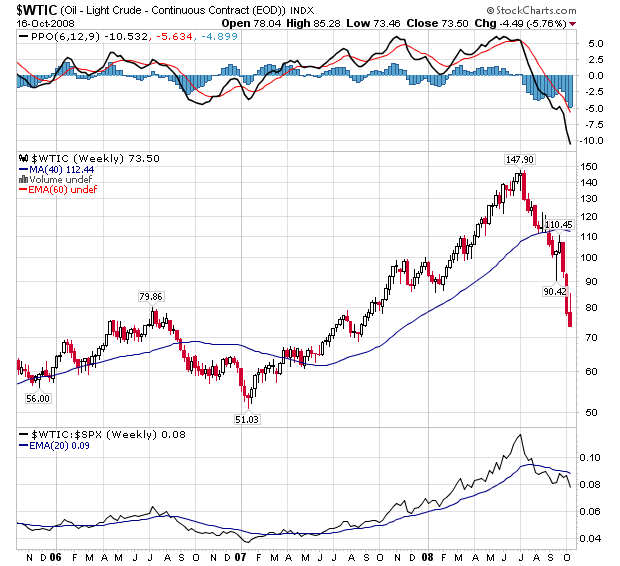
This utter collapse in oil prices is means that gasoline, which averaged about $4.10 a gallon at its peak in July, could be as cheap as $1.99 a gallon by election day, a stunning decline! This is beyond question going to put more money in consumers' wallets. Although there is much gloomy news in industrial production, retail sales, consumer sentiment, and manufacturing from September, if the various financial stimuli take some effect, that may be enough to give us the brief respite during the "slow motion bust." The next few weeks' data of money supply and October readings in producer price and food inflation will tell us if it is indeed so.
Even if a Respite is upon us, however, I expect it to be brief. In my next blog, I will explain why it appears more and more likely that 2009 will feature our first deflationary recession in 70 years.
Comments
deflationary?
really? Because of the massive deficit, increase in money supply.....hmmmmm....(this is for the 2009 projection).
Then on oil, it's in free fall but here comes OPEC moving up their meeting, planning (I guess) on cutting production, shooting for $80/barrel, although due to overall global economic slow down there are many who debate they can do that....I think they probably can. I also appears that hedge funds are dumping assets right and left due to their own losses, which supposedly is affecting commodities right now. so to me at least, but I'm certainly not an expert, it seems like the deflationary argument has a lot of counters.
On your just in time for the election on this one I would not be surprised!
(yeah people are going to read this post and think you're nuts, but probably miss your respite point which I don't think is so nuts)
Deflationary, because the inflation will not be enough
Or at least, not enough to overcome the main problem, which is that thesame people who lied to us to get us into this mess are still in the same positions of power.
It might grant us a respite, but it will be a *brief* respite, and the basic problem (that the world's production to debt ratio is smaller than any reasonable collective interest rate for bad debt) is still in existence.
-------------------------------------
Maximum jobs, not maximum profits.
Except ... what was putting the brakes on ...
... the recession in Q2 was the export sector, and with financial contagion, there is no sign from Q3 of an export-led recovery. So rather than a shallow recession, we are going to get a shallow preliminary slide followed by a steep dive.