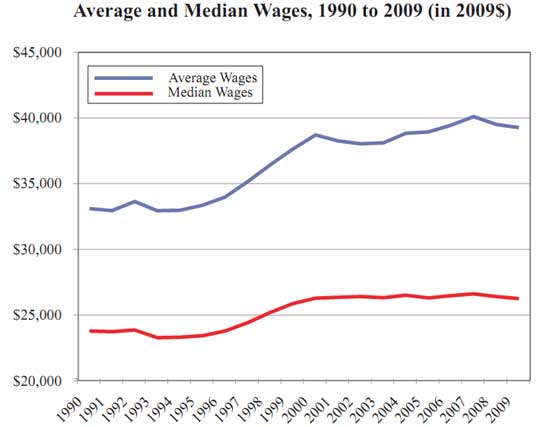
There are 150,917,735 wage earners in this country for 2009. That said, 24,315,992 of them earned less than $5000. 50% earned less than $26,261 in 2009. There are only 0.794% of wage earners who get more than $250,000 per year and only 1.266% of American salaries are over $200,000.
Brought to you by Halloween for Banksters - For us, every day is a holiday. Terrorizing the middle class 24/7, 365 days a year. That's right invisible man!
Good Morning! Rise and Shine! Get that Cup O' Joe...
break out the O.J....hang out with the pooch...time to check out the Funnies.
Initial weekly unemployment claims is a volatile number and subject to revisions. Every week the press and traders go nuts at the latest numbers and frankly weekly reports have too much statistical noise in them to declare the job war against the American middle class over.
New Residential Home Sales increased 6.6% from last month, with an annual rate sale of 307,000 new homes. Last month's new home sales were revised up 1.1%. There is now an 8 month's supply to sell new homes at the current rate. Below is the new home sales graph since 1980. Just seeing how low new home sales are in comparison to the last 30 years is worth a look.
New Orders in Durable Goods increased 3.3% for September 2010. New orders has declined 2 of the past 4 months, with July showing a slight 0.7% increase. New orders in non-defense capital goods increased 8.6%. Core capital goods new orders fell -0.6%.
In the population of working age adults, the non employment rate is 26.9% (28,255,000 of 105,229,000). As a comparison to current levels, in 1998, the working age population growth was 80,662,000 and the non-employed in that population was 6,571,000 (8.15%).


 It's Friday Night! Party Time! Time to relax, put your feet up on the couch, lay back, and watch some detailed videos on economic policy!
Recent comments