bust

The Deflationary Bust deepens

Consumer prices in December fell ( -1.0 %) non-seasonally adjusted. Inflation for the entire year 2008 was 0,1%! (meaning I have officially won my bet wtih Bonddad). In the first seven months of the year, driven by soaring gas prices, inflation surged 4.6%. And then the deflationary bust hit. In the last 5 months, prices have fallen ( - 4.4 %), or at an annual rate of ( - 11.0%). Here is how our Deflationary Recession compares with others from the past 100 years, as of year end 2008:

Recession dates/ YoY, monthly deflation/greatest +/- change

Recession Time Period -1.5% Deflation Largest Change
1/13 - 12/14 2 - 4/14 (-3.0%)
8/18 - 3/19 n/a (inflationary) +23.7%
1/20 - 7/21 8/20 - 9/22 (-15.8%)
5/23 - 7/24 4/24 (-1.8%)
10/26 - 11/27 1 - 5, 8/27 (-3.4%)
n/a 6/28 (-2.8%)
8/29 - 3/33 4/29, 3/30 - 8/33 (-10.7%)
5/37 - 6/38 1 - 12/38 (-3.4%)
2/45 - 10/45 n/a (inflationary) +2.8%
1/49 - 10/49 1/49 - 1/50 (-3.2%)
7/53 - 5/54 n/a (-.8%)
12/07 - ???? 10/08 - ???? (- 4.4 %)

Neutron Bomb over Wall Street?

One of the heretical thoughts I continue to hold is that the "slow motion bust" that we are living through, may not proceed to destroy the entire economy like a nuclear bomb. Rather, like a neutron bomb over Wall Street, it might destroy the financial sector but leave most of the economic infrastructure in place. If it is a worthy goal that the doctrine of "Profits are privatized, losses are socialized" must cease, then it may be an absolute tonic if several financial enterprises thought "too big to fail", nevertheless do.

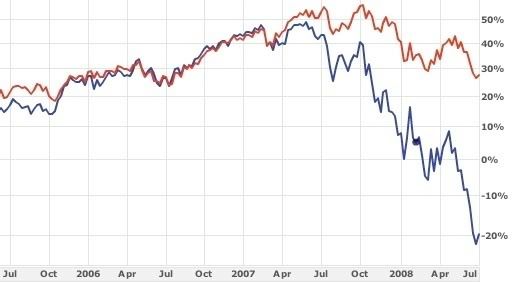
A noteworthy graph from Yahoo finance demonstrates that the "neutron bomb" scenario indeed may be unfurling. The graph below covers the last 3 years for the S & P 500 (red) and compares it with the financial sector as represented by the Financial SPDR (blue), starting from a baseline (0%) of 5 years ago: