Kasriel indicator

Economic Indicators during the Roaring Twenties and Great Depression (V).

This is the concluding installment in my series examining how the most reliable economic indicators during the Inflationary Era, perform during periods of deflation. I have done this by examining the Roaring Twenties, Great Depression, New Deal, and the Post WW 2 deflationary recession. The reason for doing so is that we are now in the midst of the first deflationary recession in 60 years. Most indicators used by economists and pundits do not exist or have never been tested that far back in time. Indicators which may work during inflations may not work during deflations. Having set forth the data for you, today we show exactly how two such indicators -- monetary and interest rates -- panned out, and the implications of those conclusions to our present situation.

Economic Indicators during the Roaring Twenties and Great Depression (IV).

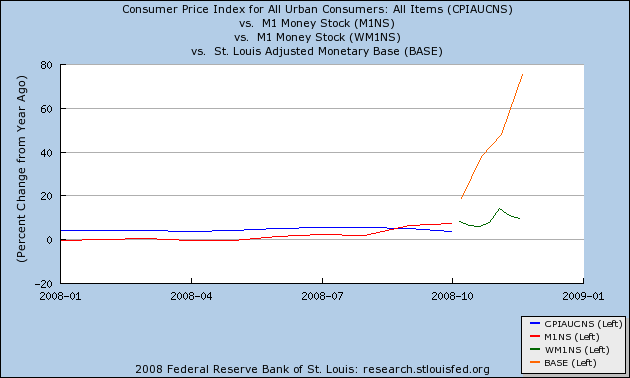
Previously in Part I of this series, I explained the need to re-examine economic indicators to determine how they performed in previous periods of deflation. In Part II, I looked at the year-over-year M1 vs. CPI indicator during the Roaring Twenties. In Part III, I looked at the same indicator during the 1930s and the post-World War 2 deflationary recession of 1948-49. That examination showed that, in the 1920-1950 period, the M1 vs. CPI indicator generally worked well, but missed the 1927 recession and most importantly of all completely failed to appropriately signal the beginning, duration, or end of the 1929-32 Great Contraction.

IV. Interest rates and the yield curve

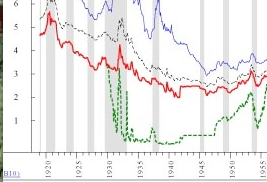
In this installment, I will look at NY Fed interest rates, short term rates, and long term rates as they apply to the entire 1920-1950 period.

Economic Indicators during the Roaring Twenties and Great Depression (II).

Yesterday I discussed the need, given our deflationary recession, to examine the reliability of economic indicators during past periods of deflation, specifically to the period from 1920 to 1950. Today I begin that examination with the 1920s.

II. The Roaring Twenties: monetary indicators

The Roaring Twenties was an era of productivity- and debt- fueled urban prosperity that contemporaries called "The New Era" in which supposedly all of humanity's economic problems had been solved. Little did people at the time know of the severe hardships that awaited them when the bubble burst. Monetarily the decade was begun with the bursting of World War 1's high inflation (much like Paul Volker was to burst 1970s' inflation 60 years later), that settled into disinflation (declining inflation) and finally into deflation.

Today I will examine the monetary component of Paul Kasriel's "infallible recession indicator" as applied to the 1920s.

Economic Indicators during the Roaring Twenties and Great Depression (I).

I. Introduction

The supporting data normally cited in the welter of economic commentary suffers from an important limitation. Almost all of those indicators date from the 1950s and 1960s onward. That is to say, they cover a period where there was not even one single deflationary event. All of their reliability comes from a period of waxing and waning inflation -- but always inflation. As we are experiencing the most significant deflationary recession since the Great Contraction of 1929-32 and the Post World War 1 deflation of 1920-21, the applicability of these indicators is very suspect.

This point was driven home to me when I saw a graph of one such very reliable post-war indicator -- the yield curve -- dating from 1929. The graph re-posted below, shows a relentlessly positive yield curve (short term rates are in green, long term rates in red).

If one were ignorant of history, one would have expected that with the exception of a couple of brief bumps, the economy would have been expanding nicely throughout the entire period from 1929-1950! Even during most of the "great contraction" of 1929-32, the yield curve was positive.

Monetary Indicators give some hope?

The economy has fallen off a cliff, but there are at least some hopeful indications that we might not have too much further to fall. Both Calculated Risk and Econbrowser have posted graphs indicating that the severe credit crunch evident during September has eased, and while the indicators haven't gone back to normal, they are at least out of the panic zone.

In addition to those, both monetary indicators I have been tracking now point to recovery.

The Deflationary Bust accelerates

Consumer prices in November fell ( - 1.9%) non-seasonally adjusted. The YoY rate of inflation is now only 1.1%. In the last 4 months, prices have fallen ( - 3.4%), or at an annual rate of ( - 13.2%). I am accordingly updating my table of Deflationary Recessions:

Recession dates/ YoY, monthly deflation/greatest +/- change

Recession Time Period -1.5% Deflation Largest Change
1/13 - 12/14 2 - 4/14 (-3.0%)
8/18 - 3/19 n/a (inflationary) +23.7%
1/20 - 7/21 8/20 - 9/22 (-15.8%)
5/23 - 7/24 4/24 (-1.8%)
10/26 - 11/27 1 - 5, 8/27 (-3.4%)
n/a 6/28 (-2.8%)
8/29 - 3/33 4/29, 3/30 - 8/33 (-10.7%)
5/37 - 6/38 1 - 12/38 (-3.4%)
2/45 - 10/45 n/a (inflationary) +2.8%
1/49 - 10/49 1/49 - 1/50 (-3.2%)
7/53 - 5/54 n/a (-.8%)
12/07 - ???? 10/08 - ???? (-3.4%)

Is a 2009 recovery still possible?

This is a follow up on my previous posts in which I discussed whether we were heading for a deflationary recession or a recovery in 2009. As we found out within the last couple of weeks, the deflationary recession is already here. But are there still grounds to believe a recovery in 2009 is possible? Money supply indicators (m1 [red, green] and monetary base[orange]) continue to indicate so as of this week's update:

It is now virtually certain that the Kasriel indicator will predict a recovery in the first half of 2009.

2009: Recession vs. Recovery (Update 4)

Update 4:
This week we got a partial answer to the query posed by the title to this series: one of my two possible outcomes was a deflationary recession (an old fashioned "bust"), featuring (-1.5%) or greater deflation on an annual or shorter basis. This week we learned that in the August-October period CPI already declined (-1.5%). Since November and December have a seasonal bias towards slightly negative (-.1 and -.2 respectively) monthly CPI readings, this deflationary recession will almost certainly last into 2009.