I've taken Mike Shedlock a/k/a Mish to task on a couple of items lately. But one of his graphs tells a very interesting and timely story that is worth a little more in-depth discussion.
Most people who have read about the Great Depression understand that part of what happened is that the money supply (M1 and M2) contracted sharply and that there is a school of thought that this was a prime driver of the Depression. But then there's the anomaly shown in this graph:
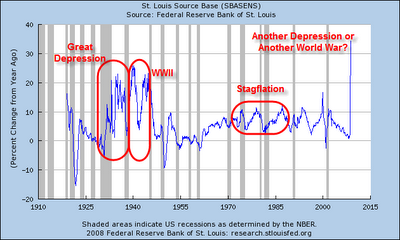
As I will discuss below, the two spikes in the monetary base - in December 1930 and October 2008 - have a lot in common.

Recent comments