The U.S. September 2012 monthly trade deficit declined by -5.1%, or -$2.25 billion. August's trade deficit was revised down by -$427 million, which gives a 3.1% monthly increase instead of the originally reported 4.1%. While the press touts the lowest monthly trade deficit since December 2010, the reality is September gives the second largest China trade deficit in history.
The U.S. August 2012 monthly trade deficit increased 4.1%, or $1.75 billion. July's trade deficit was revised upward by $462 million, which gives a 1.4% monthly increase for July's trade deficit instead of the reported no change. For August, exports decreased by -$1.91 billion, or -1.0%. Imports declined by -$845 million, or -0.4%.
The U.S. international transactions release is an odd duck. The current account is kind of like an economic income statement of the U.S. vs. the rest of the world. The current account deficit was $117.4 billion for Q2 2012, a 12.1% decline from Q1's current account deficit of $133.6 billion.
The U.S. June 2012 monthly trade deficitdeclined $5.12 billion to $42.924 billion. This is a -10.66% monthly decrease in the trade deficit, mainly due to increased exports. Exports increased $1.666 billion, or +9.09%. Imports declined $3.454 billion, a -1.49% decrease from May and mainly due to lower crude oil prices. This is the smallest monthly trade deficit in 18 months.
The U.S. May 2012 monthly trade deficitdeclined $1.91 billion to $48.68 billion. This is a 3.78% monthly decrease in the trade deficit, all due to reduced imports. Exports decreased $359 million, or -0.20%. Imports declined $1.55 billion, which is a -0.67% decrease from April. The decline in oil prices is the reason the trade deficit shrank for the month.
The U.S. April 2012 monthly trade deficitdeclined $2.56 billion to $50.06 billion. This is a 4.88% monthly decrease in the trade deficit. Exports decreased $1.53 billion, or -0.83%. Imports declined $4.09 billion, which is a -1.73% decrease from March. That said, don't be so overjoyed that the trade deficit declined.
The U.S. March 2012 trade deficitjumped $6.41 billion to $51.83 billion in a month. This is a 14.1% monthly increase in the trade deficit. Exports increased $5.28 billion, a 2.9% increase from last month. Imports increased $11.69 billion, which is a 5.15% increase from February.
The U.S. February 2012 trade deficitshrank $6.5 billion to $46 billion in a month. This is a 12.37% monthly decrease in the trade deficit. January's trade deficit was revised slightly down to $52.5 billion.
The January 2012 U.S. trade deficit increased $2.14 billion to $52.57 billion in a month. This is a 4.25% increase from last month in the trade deficit and the highest since October 2008. December's trade deficit was significantly revised up by $1.62 billion.
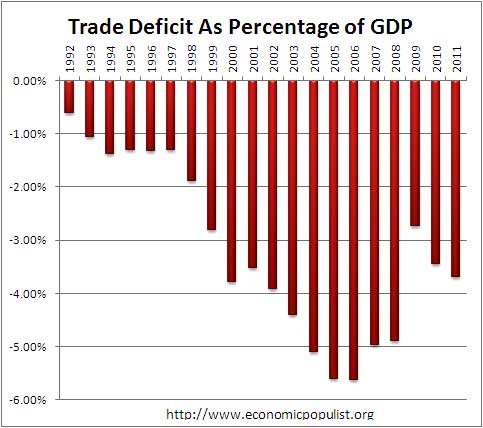
The annual trade data out of the December trade report has some shocking results. The 2011 trade deficit increased 11.6% from 2010. As a percentage of GDP the trade deficit is returning to pre-recession levels. The trade deficit is now 3.7% of U.S. GDP, up from 3.4% in 2010. The worst was 2006, when the soaring out of balance, trade deficit was 5.6% of GDP. Below is a graph of the U.S. trade deficit as a percentage of U.S. annual nominal GDP.

Recent comments