
The Feburary 2011 ISM Manufacturing Survey is out. PMI came in at red hot, furnace blasting 61.4%. January manufacturing ISM was 60.8%. This is a +0.6% increase from last month in the factory index and it's highest level since May 2004. The employment index rose to an astounding 64.5%, a 2.8% increase from last month. The last time the ISM manufacturing employment index was higher, was January 1973! The ISM also notes the unemployment index has only been above 60 three times in the last decade.

The ISM has a correlation formula to annualized GDP. They claim this month's PMI correlates to a 6.6% annualized GDP increase, the last two months implies a 6.5% GDP increase. Last month, Paul Krugman ran a regression analysis of the ISM PMI again GDP and proved the PMI to GDP correlation is correct. This is what the Institute of Supply Management survey respondents said, which is fairly negative considering this absolute blow out report:
- "A continued weak dollar is increasing the cost of components purchased overseas. It is going to force us to increase our selling prices to our customers." (Transportation Equipment)
- "We continue to see significant inflation across nearly every type of chemical raw material we purchase." (Chemical Products)
- "Our plants are working 24/7 to meet production demands." (Fabricated Metal Products)
- "Prices continue to rise, while business limps along at last year's pace." (Nonmetallic Mineral Products)
- "Overall demand is off 10 percent." (Plastics & Rubber Products)
New orders increased 0.2 percentage points to 68%. The ISM is reporting this is export driven and will force manufacturers to increase inventories.

Production, which is the current we're makin' stuff now meter, increased 2.8 percentage points to 66.3%. The Fed reported a decline in January for industrial production, yet that was due to energy.

Below is the ISM table data, reprinted, for a quick view.
| MANUFACTURING AT A GLANCE February 2011 | ||||||
|---|---|---|---|---|---|---|
|
Index |
Series Index February |
Series Index January |
Percentage Point Change |
Direction |
Rate of Change |
Trend* (Months) |
| PMI | 61.4 | 60.8 | +0.6 | Growing | Faster | 19 |
| New Orders | 68.0 | 67.8 | +0.2 | Growing | Faster | 20 |
| Production | 66.3 | 63.5 | +2.8 | Growing | Faster | 21 |
| Employment | 64.5 | 61.7 | +2.8 | Growing | Faster | 17 |
| Supplier Deliveries | 59.4 | 58.6 | +0.8 | Slowing | Faster | 21 |
| Inventories | 48.8 | 52.4 | -3.6 | Contracting | From Growing | 1 |
| Customers' Inventories | 40.0 | 45.5 | -5.5 | Too Low | Faster | 23 |
| Prices | 82.0 | 81.5 | +0.5 | Increasing | Faster | 20 |
| Backlog of Orders | 59.0 | 58.0 | +1.0 | Growing | Faster | 2 |
| Exports | 62.5 | 62.0 | +0.5 | Growing | Faster | 20 |
| Imports | 55.0 | 55.0 | 0.0 | Growing | Unchanged | 18 |
| OVERALL ECONOMY | Growing | Faster | 21 | |||
| Manufacturing Sector | Growing | Faster | 11 | |||
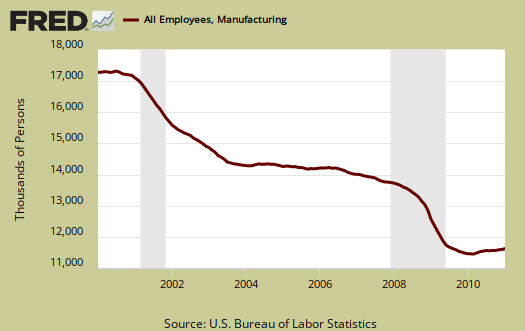
Now we come to employment. If manufacturing has expanded for the last 19 months, and now we have a blow out, where are the damn jobs? According to the ISM, anything about 50.1 correlates to an increase in manufacturing employment as reported by the BLS. Really ISM? From the below graph we have the ISM manufacturing employment index above 50.1 consecutively since December 2009. Last month, the unemployment report finally showed 49,000 manufacturing job growth in a month.
Below is the BLS manufacturing non-farm payrolls (jobs) for the past decade on the left, graphed against the ISM manufacturing employment index on the right. The BLS number is simply raw manufacturing jobs tally, not taking into account population growth or overall sector shrinkage as well as time lag. One can eyeball a slight correlation in the middle of the decade, yet note the divergence this recovery, starting late 2008, to date. Let's hope the latest BLS report out in a few days proves this trend wrong.
Inventories, in the below St. Louis FRED graph, declined 3.6 percentage points to 48.8%. The ISM says inventories above 42.7% indicate expansion, yet that's quite a slowing. Inventories had a massive negative blow out on Q4 GDP.

Exports increased 0.5 percentage points, which seems consistent with the ISM's claim new order percentage point increases were driven by exports.

Prices increased to 82% and the ISM reports this is the highest since July 2008.

The ISM neutral point is 50. Above is growth, below is contraction, although the ISM is this report is noting some variance in the individual indexes (see their report). For example, A PMI above 42, over time, also indicates growth.
In terms of which industries were doing really well, Apparel, Petroleum and Coal topped the lists, whereas Furniture is still stuck in the doldrums.
The ISM has much more data, tables and analysis on their website. For more graphs, see St. Louis Federal Reserve Fred database and graphing system.
by the way, manufacturing is not "red hot"
Trade Reform pointed to some Huffington Post article claiming U.S. manufacturing is "red hot". This report is red hot, but the manufacturing sector, as a whole has shrunk and has a long, long way to go before earning the label "red hot". So, take this report in perspective of the declines in U.S. manufacturing, particularly in the last decade.