
Earlier we reviewed the February 2011 BLS unemployment report. This post goes into a more unemployment and jobs details not covered previously.
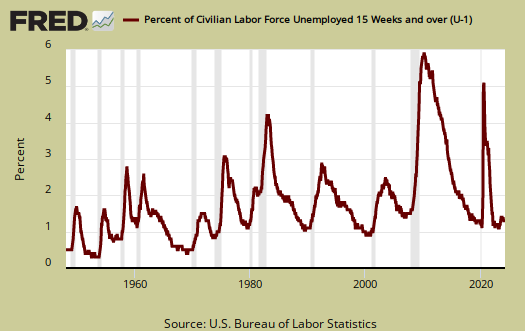
Below is a new graph, courtesy of the Saint Louis Federal Reserve, for the unemployment rate of just those unemployed 15 weeks or longer. 5.3% of the people who are officially counted as part of the civilian labor force have been so 15 weeks or longer.
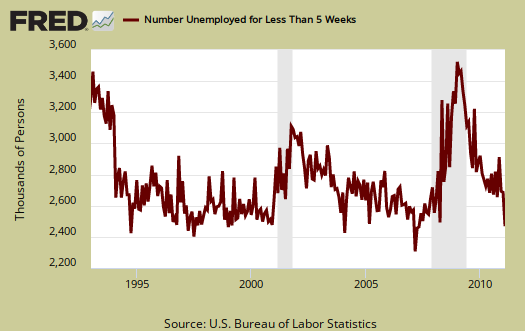
There are -288,000 less people who are unemployed for less than 5 weeks. This would correspond to the lowered initial unemployment claims. 15 to 26 weeks unemployed also dropped -106,000 yet those unemployed 5 to 15 weeks increased 78,000. Below is the graph of those unemployed for less than 5 weeks. Notice a clear downward trend and a return to pre-recession levels. In spite of everyone in America being fired by now, the below is a very positive trend. This does not discount the fact the United States still has a job crisis, but let's take good news where we can find it.
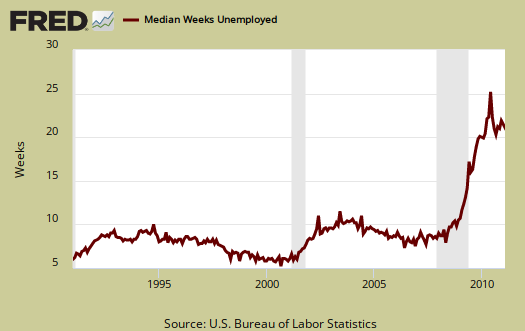
While the median, or the time it took for half of those unemployed to land a new gig, dropped, below is the median time being unemployed graph for the last 20 years. Look at the pathetic dramatic increase. That means there is overall lost income by being out of work longer and we haven't even discussed how the new jobs are paying way less and most of the jobs being created are low paying jobs.
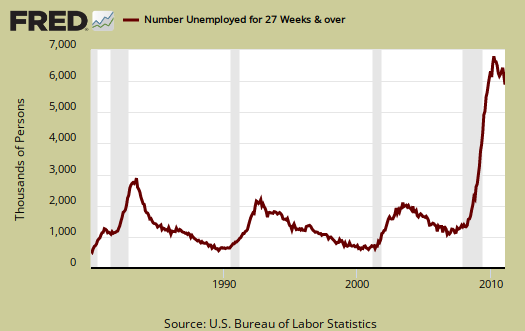
The long term unemployed (> 27 weeks) dropped by -217,000 in February. The problem with this number is we do not know the percentage of those who plain fell off the count and didn't get a job. 43.9% of the official unemployed have been so for 27 weeks or longer. Those employers refusing to give a job to someone who needs a job, refusing to hire someone unemployed....should be sued for discrimination in my opinion.
- Long term unemployed - 5.993 million
- Forced Part Time - 8.340 million
- Marginally attached to the labor force - 2.730 million
Of the Marginally attached, 1.020 million are discouraged. While forced part-time dropped -67,000 this month, the marginally attached, or those not counted but really wanting a job, increased 203,000, not seasonally adjusted, over the past year. These 2.73 million marginally attached are not counted in the official unemployment rate, but you can be guaranteed they do need a job.
U6, defined as total unemployed, plus all persons marginally attached to the labor force, plus total employed part time for economic reasons, as a percent of the civilian labor force plus all persons marginally attached to the labor force, (table A.15), was 15.9%.
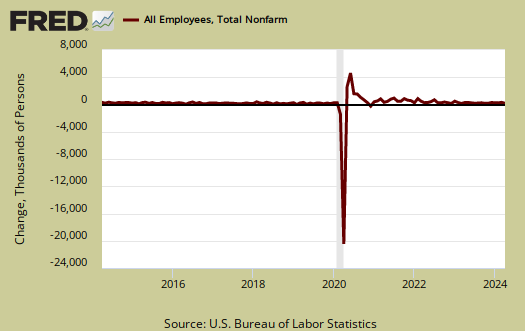
To even get back to pre-recession unemployment rate levels we need a good 424,000 jobs created each month. That's permanent jobs. Even if the U.S. created 400,000 permanent jobs each month, it would take over 18 months to recover the jobs lost since January 2008, or the start of the great recession. If one created 400,000 jobs per month, to get to the start of the great recession unemployment rate of 5%, or roughly 10.5 million jobs, it would take over 26 months, or over 2 years to recover. Below is the seasonally adjusted monthly change in the number of payroll jobs in the U.S. See a lot of over 400,000 monthly increases in the past decade?
In looking over table B1 we can get a little more detail on what kind of jobs were created (and lost) on the permanent jobs front.
- Financial: +3,000
- Information: 0
- Construction: +33,000
- Specialty Trade: 27,700
- Manufacturing: +33,000
- Durable: +30,000
- Mining & Logging: +4,000
- Health and Education: +40,000
- Leisure and Hospitality: +21,000
- Professional & Business Services: +47,000
- Temporary: +15,500
- Administration and Waste Services: +36,400
- Trade, Transportation, Utilities: +27,000
- Retail Trade: -8,100
- Government: -30,000
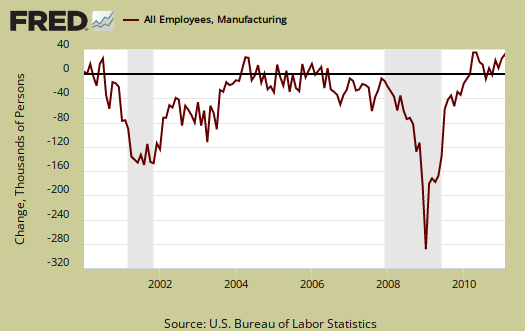
Below is the graph of the monthly change in manufacturing payroll jobs, seasonally adjusted, against the ISM Manufacturing Employment Index. If one recalls the February ISM report had as blow out on U.S. manufacturing employment. While the ISM manufacturing employment index does model the monthly change, this month we didn't get an exact correlation, i.e. no blow out. Also, it appears the ISM index doesn't capture the overall decline in manufacturing jobs over time.
Bear in mind illegal workers and foreign guest workers are counted as employed Americans, which can distort occupational sectors, particularly the Engineering, I.T., Science and Technology ones. Below are the unemployment rates per occupational sector from table A-14, not seasonally adjusted.
- Financial: 6.9%
- Information: 6.7%
- Construction: 21.8%
- Manufacturing: 9.9%
- Transportation, Utilities: 9.0%
- Information: 6.7%
- Mining & Gas, Oil: 5.6%
- Health and Education: 5.6%
- Leisure and Hospitality: 13.8%
- Professional & Business Services: 10.1%
- Retail, Wholesale Trade: 9.2%
- "Other" Services: 8.9%
- Government: 4.2%
- Agricultural: 18.4%
- Self-employed, unpaid family: 5.9%
Probably the most horrific not seasonally adjusted unemployment rate is the 10.1% for Professional and Business Services unemployment rate. This occupation category implies a college degree. Legal and Accounting dropped this month, but this particular area is fraught with foreign guest worker Visas, which distorts the real occupational unemployment rate. If an American is displaced by a foreign guest worker, then is forced to take a job at Walmart, that person is no longer categorized as a Chemical Engineering PhD out of work, but instead as a retail trade worker.
The above numbers are not seasonally adjusted so part of the agricultural and construction rates are due to the seasons, that said, construction unemployment has been decimated anyway you look at it.
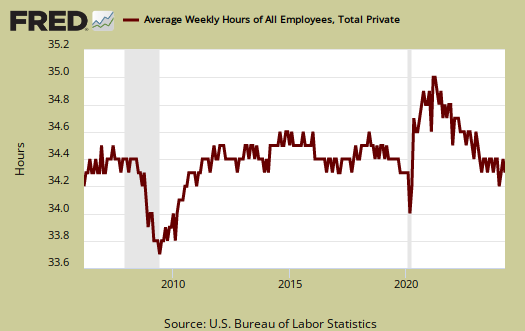
The average work week remained the same, 34.2 hours. Average earnings for the private sector (drum roll please), increased 3¢ to $22.87/hr. Yet the worker bees, or non-supervisory jobs average pay is $19.33. Take a look at how many industry sections are below full time hours. Is a common practice among employers to keep workers part-time, in order to deny them full-time benefits.
You probably also want to know the birth/death model. What is that? It's a statistical adjustment to compensate for new businesses and dead businesses who are not actually tallied by data reports. Those jobs created and died outside the statistical reporting time window due to lag. So, the BLS estimates how many jobs can be attributed to those firms which are not actually counted. This month's adjustment was +112,000 jobs. Now one cannot directly subtract the birth/deal model monthly numbers, because unemployment data is seasonally adjusted, yet the birth/death adjustment is not seasonally adjusted, get that? Anywho, jobs attributed to new and dead businesses are just an estimate in so many words. Not seasonally adjusted, payrolls added 816,000 jobs, as an example of why one cannot apply the birth/death model to seasonally adjusted data.
Last month has two overviews on the unemployment report, the first overviewing the yearly adjustments and giving some background on the data used for non-institutional civilian population and the second goes through BLS unemployment calculation exercises, to show where various economists get their minimum job growth numbers to keep up with population.
So What's The Government's Plan
Do you think it's possible we'll be creating 400,000+ new jobs?
Do you think it's possible we'll be creating 300,000+ new jobs within the next year?
Why is nothing being said about:
1. Reducing use of temporary work visas. We should be on a campaign to attack the "body shops" who exploit foreign workers and the Americans they take jobs away from. Why are we so afraid; the body shops aren't American owned.
2. Moratorium on extended family reunification immigration (siblings, parents, adult children). We don't need the sister of a former immigrant here; we do this to be nice. What we need is jobs for Americans!
3. More unemployment and other financial support for the long term unemployed. In most states able bodied adults can't even get welfare, not that the $200 or so you'd get would pay your rent or mortgage.
4. Food Stamps for long term unemployed who still have assets. AP did an article last summer that said about 20 states were now allowing people to get Food Stamps if they were not getting any current income. It's 100% federal government paid; states pay 1/2 administrative costs. For the time being I think this should be available in all 50 states. That's about $200 a month per person that people won't have to take out of their savings or beg from friends and relatives.
It doesn't matter if "things are picking up" if the rate is so slow that you won't get a job for another couple of years. I am so sick of the happy talk. What will it take for President Obama to acknowledge the terrible economic conditions out there for the down-and-outers?
I am getting a bit sick of all the coverage focused on public worker unions. Whatever happnes most of them will still have their jobs and pensions next year at this time. The few who lose their jobs will often have their own unions to blame for keeping current salaries -- and often continuing to get contracted raises -- and benefits during a financial crisis.
Meanwhile the noose tightens around the long term unemployed and nobody's doing anything.