
The October Consumer Price Index, which measures inflation, decreased -0.1% from last month. The overall decline was caused by a -2.0% energy decrease for the month. Food increased 0.1%. Gas alone decreased -3.1% in a month and food at home, or groceries, increased 0.1%. Core CPI, or price increases minus food and energy costs, rose 0.1%. Core CPI is a Federal Reserve inflation watch number. For the year, not seasonally adjusted, the Consumer Price Index for all Urban Consumers (CPI-U) has risen 3.5%. In September, CPI increased by 0.3%.
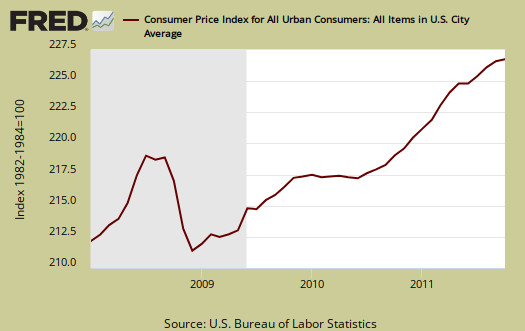
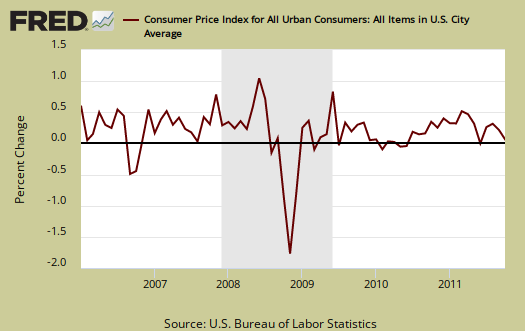
Core inflation is staying reasonably flat, at March lows. Below is the monthly percentage change in CPI-U, all items. U stands for Urban consumers.
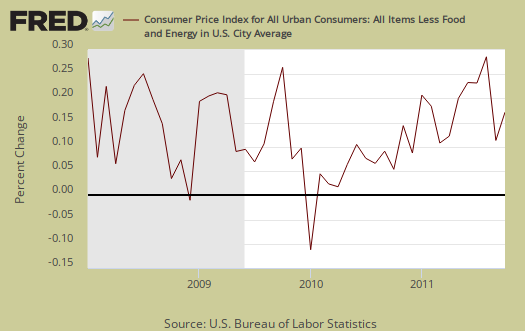
The core CPI, or all items less food and energy, percentage increase was 0.1%. August core CPI was 0.2%. Don't get too excited, medical care increased 0.5% in a month, while used cars dropped -0.6%. You can more cheaply drive a beater rust bucket while trying to pay for health care. New autos also dropped -0.3%. Transportation overall dropped -1.1%.
Shelter is up 0.2%, with rent increasing 0.4%. Rent is the biggest monthly expense so this is not good news. Home owners equivalent rent of primary residence also increased 0.2% but hotels, motels dropping -1.7%. Clothing increased 0.4% offsetting it's last month's dramatic -1.1% decrease.
Core CPI's monthly percentage change is graphed below. As we can see, overall, without energy and food, inflation is abating. If you're wondering why the graph looks weird, the graph calculates percentages from the index and doesn't round. The actual data from the BLS report does round to one decimal place. In other words, 0.05% is rounded to 0.1%. Basically core inflation increased slightly from last month, but is still hitting yearly lows.
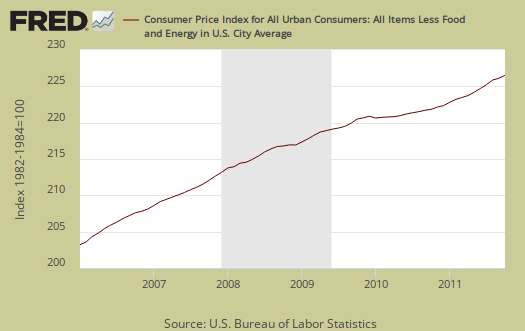
Below is the St. Louis FRED graph to show the overall index on core CPI, or CPI without food and energy included. We are seeing an acceleration uptick in core although the recession, which includes the late 2008, early 2009 time period where CPI was deflationary.
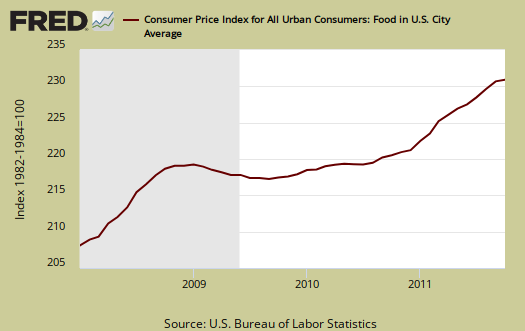
Food and beverages as well as groceries increased, 0.1% in October and the food index is up 4.5% for the year. Food at home, or groceries, increased 0.1% and is up 6.2% for the year. Dairy increased 0.1%, and is up 9.0% for the year. Meats increased 0.5% and are up 7.4% since a year ago. Fats & Oils, if you can believe this, are up 11.1% from a year ago. Fruits & Vegetables dramatically dropped, -1.7% for October, but are up 5.2% for the year.
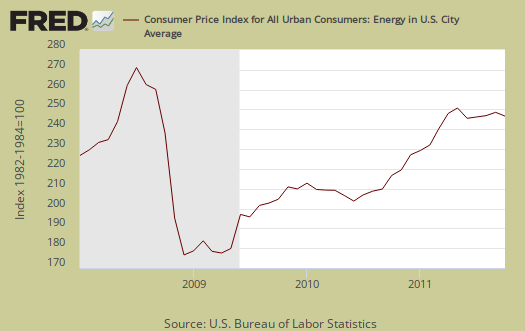
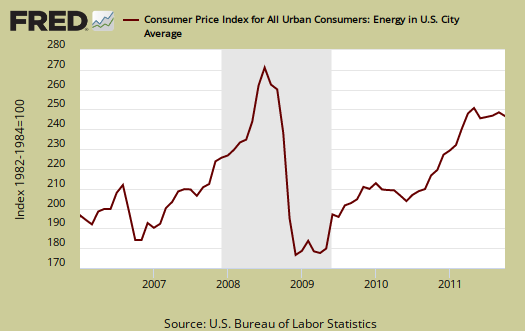
Energy overall decreased -2.0%, reversing Septembers 2.0% increase. The energy index is still up 14.2 % for the year. Gas alone decreased -3.1% for October but is still up 23.5% for the year. Heating your house with gas just got cheaper. Utility gas dropped -3.0% for October and is down -2.2% for the year. Household energy decreased -0.3%, but fuel oils for households increased 0.1% in October and is up 21.2% for the year. Anyone else thinking a 21.2% increase to heat your home is ridiculous? Below is the CPI-U Energy Index.
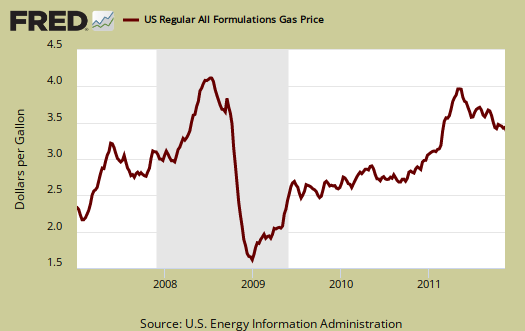
Oil is hitting $100/barrel, so don't expect the decline in energy prices to last. Below are gas prices, last updated November 14th. Notice the oil bubble in early 2008 and notice how close gas prices are now to that previous oil bubble. This CPI report only goes to October.
The CPI energy index, capturing the last oil bubble below, is all energy, gas, natural gas, fuel oil and so on. Notice it's dip and return versus the food index as well as how it's not as high as the CPI energy index was during the oil commodities bubble of 2008.
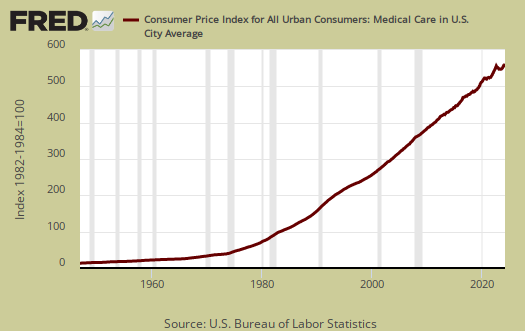
The Medical index increased 0.5% for the month and Medical care increased 0.5%, with services increasing 0.3%. Medical commodities are things like your prescription drugs and it increased 0.3% from last month. Strange isn't it, that Medical care is never mentioned when referring to costs and inflation. It's only as important as food, yet health care is treated almost like it's an extra for daily living. For the year, medical care is up 3.1%.
There has been much criticism as of late that the Federal Reserve only focuses in on core CPI, instead of food and energy. According to the BLS, Food and beverages, which includes food at home, makes up 14.8% of the index. Housing is 41.5% and transportation, including gas for the car, is 17.3%. Medical care is only 6.6%, they claim. All items minus food and energy are considered 77.2% of the total price expenditures for consumers.....according to them.
Regardless, this flattening in core CPI will probably keep the Federal Reserve doves (quantitative easing) talking.
The DOL/BLS does take yearly surveys on where the money goes in the monthly budget, but as one can see, food and energy are significant amounts of the monthly finances. Run away costs in these two areas can break the bank, so can food.
CPI-W for the month, unadjusted was 223.043, a -0.1% increase from last month and a 3.9% increase for the year. CPI-W is used to calculate government transfer payments, such as social security increases.
Note the the chained CPI-U also increased 3.4% for the year and this is not seasonally adjusted. Chained CPI is in 2005 dollar values, which has a flattening effect on real inflation, thus flatting cost of living adjustments if used.
Last month's CPI report overview, unrevised, although most graphs are updated, is here.
chained CPI, this article is true
As site administrator I periodically check who is linking to EP and this post is, using this overview as a data reference. The article describes the fiction and pain using chained CPI for social security adjustments will cause.
It's bad enough COLA adjustments are done using only 1 quarter per year, in terms of adjusting for inflation on social security benefits.