
The National Association of Realtors revised existing home sales for for 2007-2010. 2010 was revised downward by 14.6% as well as the entire three year period, 2007-2010 was also revised down by 14.3%. 2010 existing home sales benchmark revisions are now 4,190,000. Previously the NAR claimed 4,908,000 sales.
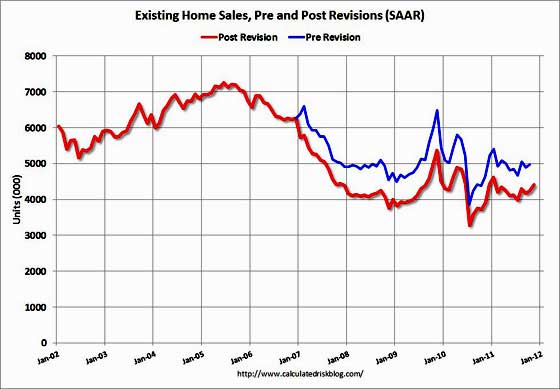
Graph: Calculated Risk
The NAR claims these revisions will have minor impact on GDP. Little does one know, the BEA, through the Department of Commerce, uses the NAR existing home sales data to compute the residential investment component of GDP. That said, the only inputs are transaction costs, which are things like brokerage commissions. The actual sale of a existing home is not new growth but more of an investment transfer and thus not part of new growth, or gross domestic product. Additionally, residential investment already is D.O.A., contributing little to overall GDP growth. Sales prices were not revised, just volume and pretty much sales volume where there were no broker fees. While existing home sales revisions are fairly draconian, bottom line, they will not affect 2007-2010 GDP numbers.
The dramatic downward revisions were blamed on an overestimation of for sale by owner. Seems the NAR was assuming a 16% market share of existing homes sold without the use of a realtor and that percentage dropped to 9% for 2010.
A divergence developed over time between sales reported by MLSs and sales determined by a U.S. Census benchmark; the variance began in 2007. Reasons include growth in MLS coverage areas from which sales data is collected, and geographic population shifts. “It appears that about half of the revisions result solely from a decline in for-sale-by-owners (FSBOs), with more sellers turning to Realtors® to market their homes when the market softened. The FSBO market was overwhelmed during the housing downturn, and since most FSBOs are not reported in MLSs, national estimates of existing-home sales began to diverge based on previous assumptions,
What the hell happened? Well, the NAR tried to use court case documents to figure out the real percentage of existing homes being sold without a realtor involved and surprise, there were too many data holes, inconsistencies to get a good estimate. Additionally the 2010 Census data for existing home sales hasn't been number crunched. So, the NAR finally used the Census American Community Survey to get their final numbers. Voilà, way fewer people were able to sell their home by themselves than in 2000.
Inventories were also revised downward 14.3% for years 2007-2010, again similar reasons as the existing sales revisions.
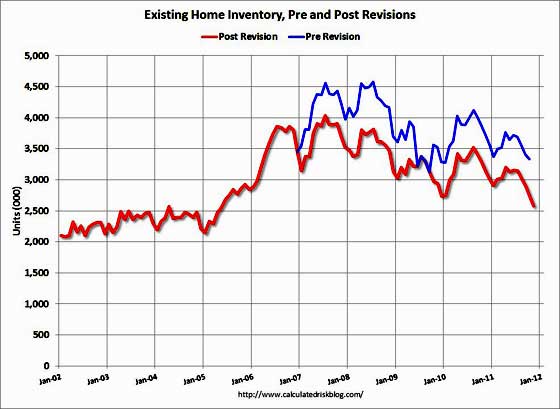
Graph: Calculated Risk
One of the signs people simply cannot afford to buy a home these days are contract failures. A third of contracts failed in November as well as October 2011.
An elevated level of contract failures continues to hold back a broader sales recovery. Contract failures were reported by 33 percent of NAR members in November, unchanged from October but notably above a year ago when it was 9 percent.
Contract failures are cancellations caused by declined mortgage applications, failures in loan underwriting from appraised values coming in below the negotiated price, or other problems including lower conforming mortgage loan limits, home inspections and employment losses.
The NAR also released November 2011 existing home sales and show a 4.0% sales increase from October:
Total existing-home sales, which are completed transactions that include single-family, townhomes, condominiums and co-ops, increased 4.0 percent to a seasonally adjusted annual rate of 4.42 million in November from 4.25 million in October, and are 12.2 percent above the 3.94 million-unit pace in November 2010.
Inventories dropped and now represent a 7.7 month's supply at current, annualized sales rates of existing homes.
Total housing inventory at the end of November fell 5.8 percent to 2.58 million existing homes available for sale, which represents a 7.0-month supply at the current sales pace, down from a 7.7-month supply in October.
The median sales price dropped in November to $164,200, -3.5% from one year ago. Distressed sales increased to 29% of all sales from 28% last month. The NAR gave the breakdown of distressed sales. 19% were foreclosure sales and 10% were short sales.
One of the few sites which really got the NAR revisions right is Calculated Risk. They also keep running data sets and have many graphs of NAR housing data available.
Many are blasting these revisions
But if anyone is paying attention, we see major revisions to employment statistics, GDP, income that are absolutely huge. Some are also saying the NAR is counting new home sales. I don't buy that one, but the NAR was behind the warm fuzzy, all is good, juju while people who knew what they were talking about were screaming through the rooftops there was a housing bubble going on which would lead to big trouble. Of course short term commissions and profits overrode any statistics, mathematics and logic.