
The S&P Case Shiller home price index shows a -3.7% decline from a year ago over 20 metropolitan housing markets and a -3.6% decline for the top 10 housing markets from November 2010. Home prices are back to early 2003 levels. S&P on the continued falling home prices:
The trend is down and there are few, if any, signs in the numbers that a turning point is close at hand.
Below is the yearly percent change in the composite-10 and composite-20 Case-Shiller Indices. These are not seasonally adjusted, but comparing from November 2010.

Wondering why we have conflicting news headlines on the S&P Case-Shiller Housing Index? Because some in the press use the seasonally adjusted data, and others do not. S&P themselves use the not seasonally adjusted numbers for their headlines and press releases. To make matters worse, some compare just the monthly not seasonally adjusted data and others compare the housing price index to one year ago, without telling you what number they are quoting from S&P. That's why on this site we make sure you know which apple you're looking at, all data is identified.
This month the not seasonally adjusted October to November change for the composite-20 was -1.3%. The seasonally adjusted composite-20 monthly change was -0.7%. The composite-10 not seasonally adjusted monthly change was -1.3% and the seasonally adjusted composite-10 monthly change was -0.7%. Intuitively, the divergence of the seasonal adjustments in November makes sense. The housing season is over. Bottom line, anyway you look at the Case-Shiller numbers, single family housing prices declined.

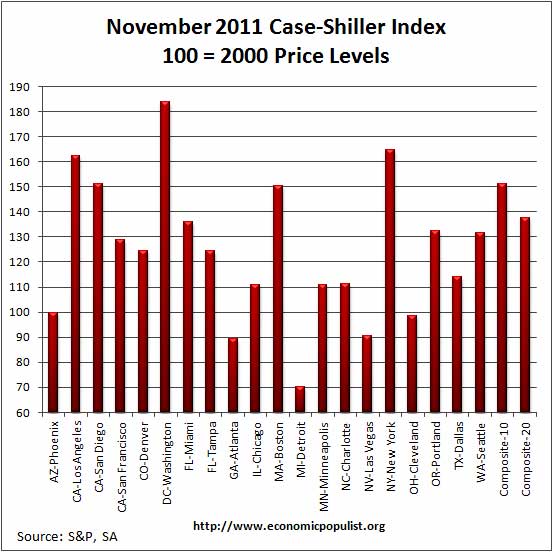
The above graph shows the composite-10 and composite-20 city home prices indexes, seasonally adjusted. Prices are normalized to the year 2000. The index value of 150 means single family housing prices have appreciated, or increased 50% since 2000 in that particular region. These indices are not adjusted for inflation. The composite-20 index, seasonally adjusted is 137.52 and comparable to February 2003 levels (ignoring 2009). Not seasonally adjusted the composite-20 index is 138.49, equal to April 2003 levels. Housing prices are going backwards in time.
The S&P/Case-Shiller Home Price Indices are calculated monthly using a three-month moving average and published with a two month lag. Their seasonal adjustment calculation is the standard used for all seasonal adjustments, the X-12 ARIMA, maintained by the Census.
So, why would S&P report the not seasonally adjusted data? According to their paper on seasonal adjustments, they claim the not seasonally adjusted indices are more accurate. Why? It appears the housing bubble burst screwed up the cyclical seasonal pattern. What a surprise.
The turmoil in the housing market in the last few years has generated unusual movements that are easily mistaken for shifts in the normal seasonal patterns, resulting in larger seasonal adjustments and misleading results.
Not seasonally adjusted data can create more headline buzz on a month by month basis due to the seasonality of the housing market. S&P does make it clear that data should be compared to a year ago, to remove seasonal patterns, yet claims monthly percentage changes should use not seasonally adjusted indices and data. This seems more invalid than dealing with the statistical anomalies the massive housing bubble burst caused. Below are the seasonally adjusted indices for November 2011.
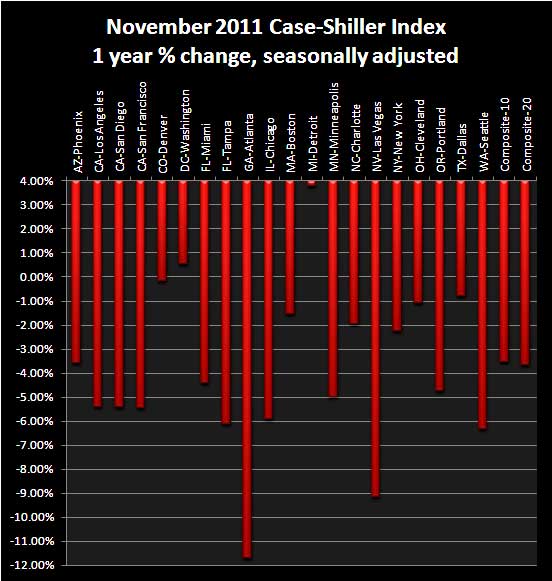
For November 2011, the S&P/Case-Shiller Home Price indexes, seasonally adjusted, shows 18 of the 20 cities tracked are down for the year. Detroit, had the best yearly increase, 3.78%, but bear in mind they have been hammered. Washington D.C. is breaking even, at 0.53%. Atlanta is down -11.72% from a year ago and Las Vegas continues it's death march, down -9.15% from a year ago.
Below are all of the composite-20 index cities yearly price percentage change, using the seasonally adjusted data.
When it comes to annual data, the seasonally adjusted and not seasonally adjusted should start to converge. Here is S&P's comment on their figures, using the not seasonally adjusted data. Notice where the jobs are not is where prices are decreasing more.
The crisis low for the 10-City Composite was April 2009; for the 20-City Composite the more recent low was March 2011. The 10-City Composite is now about 1.0% above its low, and the 20-City Composite is only 0.6% above its low. From their 2006 peaks, both Composites are down close to 33% through November.
Atlanta continues to stand out in terms of recent re lative weakness. It was down 2.5% over the month, after having fallen by 5.0% in October, 5.9% in Sept ember and 2.4% in August. It also posted the weakest annual return, down 11.8%. In addition, Atlanta, La s Vegas, Seattle and Tampa all reached new lows in November.
For more analysis, we recommend Calculated Risk, who does correct, extreme analysis and graphing on Case-Shiller data.
S&P does a great job of making the Case-Shiller data and details available for further information and analysis on their website.
Here is our overview from last month.
Come on, guys. You wrote
Come on, guys. You wrote "-3.7% decline". A negative decline (notice the double negative) would imply a positive... drop the negative sign if you're going to say "decline".
Grammar police busting double negatives
Yes, yes, but this again means you are interpreting the negative sign, a mathematical symbol, into the sentence. I just like to use the mathematical symbols in additional to the words for I, at least, am a numbers person, when scanning, I'll read the number, skip the text. But technically this is a double negative, I know.
If you want people to read
If you want people to read and respect your writing, then follow the rules of writing. If you want us to simply glean a summary, publish a summary table. I'm a numbers guy as well, but I just can't stand when ignorant grammar is used.