
Initial weekly unemployment claims for the week ending on February 18th, 2012 were 351,000. The DOL reports this as unchanged from last week. The previous week was revised, from 348,000 to 351,000, an increase of 3,000.
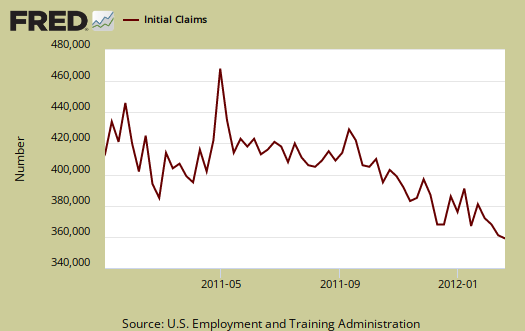
Every week initial unemployment claims are also revised and the above graph shows this report is statistically noisy. One simply cannot compare the reported numbers on a week to week basis due to the lag in States reporting claims data and revisions, plus the fact this is a 1 week time window, versus a monthly one. One needs to at minimum look at the 4-week moving average. The 4 week moving average is now 359,000 and decreased 7,000 from last week's revised from 365,250 to 366,000 4 week average. This is the lowest moving four week average since March 2008.
Below is the 4 week moving average, set to a logarithmic scale to remove even more statistical noise, for the last year. We have a clear downward trend, which is good news. The initial unemployment report is indicating moderate to modest job growth.
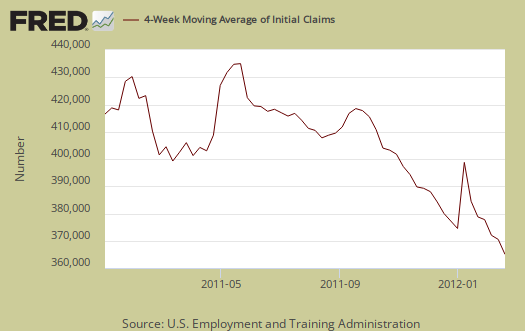
The magic number to show job creation is at minimum, below 400,000 initial unemployment claims, per week. Most Economists will quote 375,000 as the magic number to indicate job growth. Houston, we have a pattern. While UI claims have not returned to pre-recession levels, they are clearly trending down and indicating job growth, finally.
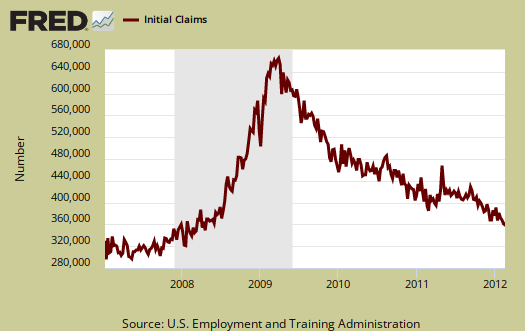
Below is the mathematical log of initial weekly unemployment claims, so one can get a better sense of the rise and fall of the numbers. A log helps remove some statistical noise, it's kind of an averaging. As we can see we have a step rise during the height of the recession, but then a leveling where every week initial unemployment insurance claims hover around 400,000, refusing to really drop for over two years, a never ending labor malaise for most of the time after the recession ended in July 2009. We seem to be finally seeing a steep decline.
Below is the 4 week moving average, set to a log scale, from January 1st, 2000. Here we can see we still are not at pre-recession initial weekly unemployment claims levels. Clearly UI numbers have greatly improved from the above trend graph. Of course everyone in America should have been fired at least once by now.
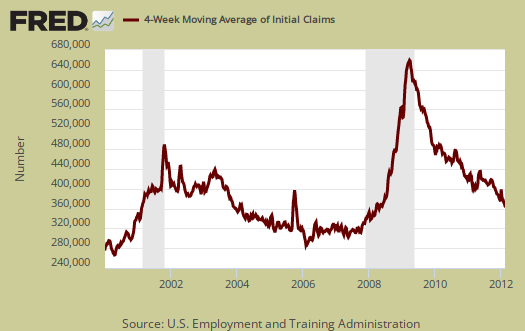
Weekly initial unemployment claims are statistically noisy, the numbers are always revised, there is large variance because it's a weekly data report instead of monthly, and only through a long term pattern can one say anything about the unemployment situation. This report is great news, and what we want to see is a strong trend, dropping down to 2007 (well, 2000 would be better), levels, where the labor market still wasn't so great.
The Financial Times blog Alphaville has been examining seasonal adjustments for bias. They have identified a dip in initial claims for January and February for the last three years.
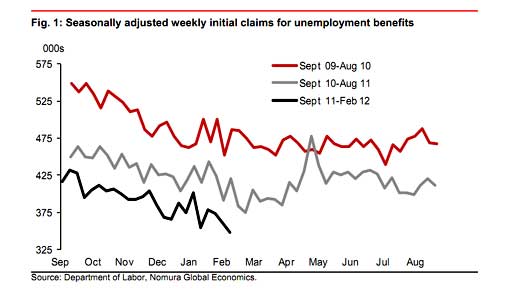
As the chart above shows, over the past three years claims have fallen from yearly highs marked in August-September to lows in February, only to stagnate in the following months
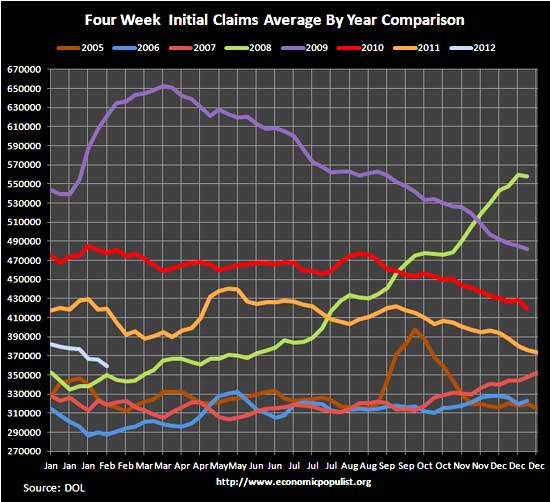
But is the above graph really valid? First, we just went through the above exercise to show when one has weekly claims data using seasonal adjustments, there will be statistical noise. Secondly, while analysis is still ongoing, it does appear the seasonal adjustment algorithms are having difficulty with years 2008-2010. The layoffs were so extreme, the seasonality of Economic Armageddon became more difficult to identify. That said, below is a graph of the four week moving average on a year to year comparison, from years 2005 to 2012. We could go back to 2000 but the graph becomes even more impossible to read. Bottom line is one should look at the four week moving average, not the weekly claims. Additionally, when looking at the 4 week moving average, the claim there is a true pattern to a decline at the beginning of the year disappears.
Continuing unemployment claims dropped but bear in mind people can plain being running out of benefits.
The advance number for seasonally adjusted insured unemployment during the week ending February 11, was 3,392,000, a decrease of 52,000 from the preceding week's revised level of 3,444,000. The 4-week moving average was 3,453,250, a decrease of 43,750 from the preceding week's revised average of 3,497,000.
In the week ending February 4th, not seasonally adjusted, the raw number was 7,502,791 official people obtaining some sort of unemployment insurance benefit. Officially, there are 12.758 million unemployed and if one takes all of the people who want a job, including those stuck in part-time because they can't get anything else, the number is over 28 million. Even at the January's job growth rate, it will take close to a decade to recover America's jobs.
Initial claims
So, if there are approx., +28m total under/unemployed
with a LFP of say +/-154m? wouldn't that put the
U6 rate around 18%-19%? If not what is the correct figure. If this is correct though, I wish you would have mentioned that. I think it it is important to list the real figures for U3 and U6 every chance we get. Since the mega-corporate owned media keeps saying that headline unemployment is 8.3% which we know is NOT true.
8.3% is a horrible number
The press acting like 8.3% is a great number is an atrocity, but 8.3% is correct, but by BLS statistical definitions. I think I last calculated out the "real" unemployment rate at 18%, tis true, but this is another type of metric. Initial claims are the number of people filing for unemployment insurance (and the percentage who do not actual get it is high). The correlation here is when people lose their job, they file. But UI only covers W2 type of jobs. It doesn't cover contract jobs for the most part or the self-employed.
It all boils down to definitions from the BLS, the types of questions asked on their survey and the survey size, plus the all important Census. If Census data is wrong, then the entire BLS CPS is wrong. (there are two surveys by the BLS, the CPS are people and where the unemployment rates come from).
But the press acting like things are all rosy with an official unemployment rate of 8.3% is pretty nuts. It should be down in the 4% range.
See this post for a graph.
That's another reason to graph data up, in one look you can see the unemployment rate is over double what it should be and that's the official unemployment rate, which has always left out large groups of people.
Anyway, I know what you're saying and I agree, the employment picture in the U.S. is horrific and that is with these improved statistics.
I Disagree
Anyone suggesting that 8.3% is a good number in and of itself is a little off. BUT so is anyone who wants to act like there's nothing positive to be garnered by such progress. It is simply a very positive figure given what we've had in recent years and given what other countries are still going through now. Quibble with the numbers all you want but the bottom line is that unemployment is going down and we are starting, at long last, to see job growth. Forget the political spin, that is amazing news for many families who are finally able to send dad/mom/both back into the working field after struggling to put food on the table, let alone pay the bills, for the last few years.
Acting like 8.3% is, on its own, fantastic is a little foolish but acting like there's nothing worth a positive outlook unless unemployment drops below 4% is not just incredibly unrealistic but also even more foolish than cheering the 8.3% rate. Looking around the globe I can't help but be extremely grateful that our country has handled this financial crisis as well as it has and yes things are starting to improve even if it is not as fast as you or others may like.
thrilled you do disagree
I'm glad to see this kind of comment for your argument is valid and it's true, we are seeing unemployment indicators decreasing, no doubt about it.
I'm just happy we have intelligent readers, right, wrong, or in-between, it's just refreshing to see intelligent debate on economic statistics here.