
Everybody is all up in arms because the weekly initial claims data was released 15 hours early. Yup, folks, people trade on this report and it's a classic example of herd behavior. Over and over again we've warned initial claims data is always revised and simply isn't something to go ballistic on, yet based in reality or not, Wall Street lives and dies on the weekly unemployment claims report.
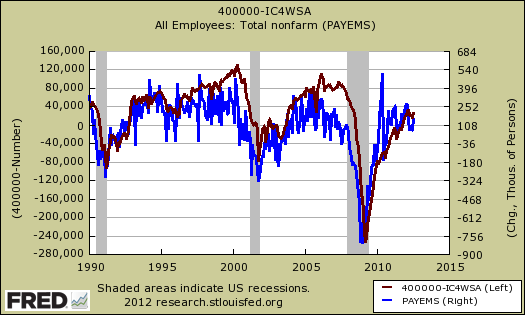
What is important is what initial claims says about real world employment in the United States. New unemployment claims show a strong correlation to job growth. The below graph shows the change in payrolls (in blue, scale to the right) against the monthly average of initial unemployment claims, four week moving average (in maroon, scale to the left). We took a magic number of 400,000 initial claims as the zero inflection point. Anything above the zero line means less than 400,000 filed for unemployment benefits, anything below zero means more than 400,000 initial unemployment claims were filed, on average for the month. What we see is a strong correlation to payrolls being above 100,000 monthly if initial unemployment claims drops below 400,000. To keep up with population growth, U.S. employment needs to generate about 100,000 jobs per month.
This is why you want to watch initial claims, job growth. That said, going off of the weekly reports is insane and below is why.
Initial weekly unemployment claims for the week ending on August 4th, 2012 were 361,000. The DOL reports this as an decrease of 6,000 from last week's revised figure of 367,000 people filing for unemployment benefits. Yet initial weekly claims are always revised. Last week's figure was revised up 2,000 from 365,000, not reported in the above difference.

The four week moving average is now 368,250, up 2,250 from last week's 366,000 number. Yet, once again, the four week moving average was also revised for last week, from 365,500. Weekly Claims are always revised due to the time lag for individual states reporting their claims data. Additionally, the unemployment filings statistic is just a one week time window. A one week time window is not statistically stable for initial unemployment data. Below is the four week moving average graph.

Below is the mathematical log of initial weekly unemployment claims. A log helps remove some statistical noise, it's kind of an averaging and gives a better sense of a pattern. We have a never ending job market malaise, we just cannot get initial claims to drop to the levels they need to be in order to really show some job growth. Notice in the above graph, initial claims really needs to drop to 360,000, but for a month to get some real umph in job growth. The recession ended officially in July 2009.

Below is the four week moving average, set to a log scale, from April 1st, 2007. Here we can see we still are not at pre-recession initial weekly unemployment claims levels. If anyone recalls, even before the Great Recession the job market was not so hot.

Continuing unemployment claims increased, and we have large long term unemployed.
The advance number for seasonally adjusted insured unemployment during the week ending July 28 was 3,332,000, an increase of 53,000 from the preceding week's revised level of 3,279,000. The 4-week moving average was 3,304,750, an increase of 4,500 from the preceding week's revised average of 3,300,250.
In the week ending July 21st, not seasonally adjusted, the official number of people obtaining some sort of unemployment insurance benefit was 5,750,084. Officially, there are 12.8 million official unemployed.
So, a statistic gets released early, frankly who cares. The fact Wall Street is placing bets on this weekly statistical release states volumes about how disconnected from reality and the real economy investors really are. It's a gambling casino and this report is like the start of the latest dice roll. Has nothing to do with unemployment and job growth in the United States. High Frequency trading never generated a job for anyone, even U.S. engineers. Have more leaks DOL. Mess 'em up, they deserve it.
Just like "Trading Places" - except that was a great comedy
I'd place all my $ with Eddie Murphy and Dan Aykroyd (and toss in baggage handler/Senator Al Franken) trying to corner the frozen orange juice market before I'd give a dime to HFT algos and their human masters. Frozen orange juice vs. trying to learn ASAP the initial claim numbers to bet on whether fewer people with jobs left to fire is good news or not (kind of like a burning neighborhood - sure, at some point there are fewer houses left standing and the rate of destruction is reduced, but tell the residents that things are looking really good and improving). "60 Minutes" ran a special on HFT (and ZH has been destroying them daily for a long time now) and the people in charge didn't see anything wrong with their admissions that the market was being made/broken by machines that could execute the quickest trades in millionths of a second and were moving physically closer to the servers to beat the competition? And retail investors are supposed to trust such gamesmanship/manipulation? Same as certain banksters using carrier pigeons from the Battle of Waterloo to exploit information arbitrage - I'll pass.
Who knew, a comedy about a man in a gorilla suit, a $1 bet, and frozen orange juice made more sense than Wall Street? No doubt Randolph and Mortimer are working in Congress somewhere under new names or in some brokerage or bank.