
In my last diary, I explained how an increase in the money supply faster than the rate of inflation, coupled with a "positively sloped bond yield curve 12 months prior, which has in the past always indicated the ending of a recession, appeared to be going positive now. A much more detailed explanation, with supporting graphs going back about 50 years, of this "Kasriel recession indicator" can be found here. While almost all financial indicators are based strictly on the post World War 2 inflationary period, the "Kasriel infallible recession predictor" accurately "predicts" the 1929 downturn, the 1933-37 and 1939-41 expansions.
Since the Kasriel indicator technically requires a full quarter of positive real M1, it has not actually flashed an "all clear" signal. The graph in my previous diary only shows positive real M1 money supply for September 2008 [Note: This morning's +.3 reading on Leading economic indicators" relies strongly on this surge in the money supply].
To the contrary, beginning in September, a host of economic indicators, some coincident, some leading, have shown the worst economy in decades: we have the worst housing starts since 1991, the worst consumer sentiment since 1979, the biggest stock market crash since 1987, the worst builder sentiment since the survey began, the biggest drop in industrial production since the survey began, a sudden 10%+ drop in retail shopping, a collapse in car sales, and on and on.
The economic issue going forward is, therefore, will the Fed and the Treasury's combined attempt to flood the financial system with money overcome the deflationary impact of a collapse of consumer spending in time to avert a deflationary recession in 2009? Despite the fact that the Federal Reserve is now increasing the money supply at a 10% annual rate, the signs are that it may be insufficient to overcome the tsunami of deflation which is just starting to crash ashore.
In particular, the commodity bubble that brought us "Peak Everything" in Oil, gold, copper, and a whole host of agricultural prices just a few short months ago, has suddenly and breathtakingly collapsed:
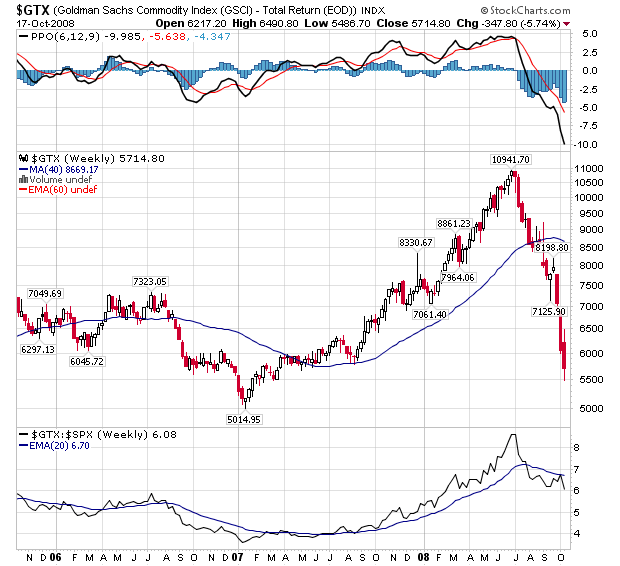
This collapse has brought about the long-awaited decline in gas prices from over $4/gallon nationally, to well under $3/gallon in many places ($2.53 in my neck of the woods), and it has manifested itself in a decline in the inflation rate for imports, producer prices, and consumer prices as well.
Bureau of Labor Statistics data going back 95 years show that with one trivial exception (one month in 1928), every single time there has been a deflation of greater than 1.5% over a 12 month or less period, it has been associated with a recession. Furthermore, the deeper the deflation, the worse the recession, as shown in the table below. Recession dates are per the NBER. Inflation figures are taken from the BLS website:
Recession dates/ YoY, monthly deflation/greatest +/- change
| Recession Time Period | -1.5% Deflation | Largest Change |
|---|---|---|
| 1/13 - 12/14 | 2 - 4/14 | (-3.0%) |
| 8/18 - 3/19 | n/a (inflationary) | +23.7% |
| 1/20 - 7/21 | 8/20 - 9/22 | (-15.8%) |
| 5/23 - 7/24 | 4/24 | (-1.8%) |
| 10/26 - 11/27 | 1 - 5, 8/27 | (-3.4%) |
| n/a | 6/28 | (-2.8%) |
| 8/29 - 3/33 | 4/29, 3/30 - 8/33 | (-10.7%) |
| 5/37 - 6/38 | 1 - 12/38 | (-3.4%) |
| 2/45 - 10/45 | n/a (inflationary) | +2.8% |
| 11/49 - 10/49 | 1/49 - 1/50 | (-3.2%) |
| 7/53 - 5/54 | n/a | (-.8%) |
All recessions since 1954 have coincided with a surge in inflation, and have not featured deflation.
Will monetary pump priming overcome consumer deflationary forces? The recent example of 2006 is instructive. In late 2006, Oil prices declined about 36% from ~$80 a barrel to $51 a barrel. The decline this year of over 50% in Oil prices is even more dramatic. This screen shot of BLS monthly inflation data for 2006-2008 shows the relative impact of deflation.
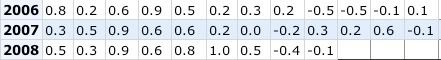
In 2006, the decline in Oil prices coincided with a -1.1% decline in consumer prices. So far in 2008, only -.5% of that decline has filtered through, even though now, unlike 2006, the consumer has collapsed.
Without going into details on this blog post, in the past I have calculated that the % change in the price of Oil year-over-year generally approximates the % change in the inflation rate. If that holds true, then by November-December the inflation rate should be somewhere in the vicinity of 3.2%. For that to happen, the September and October CPI readings must show a deflation of greater than 1%. This is consistent with the abrupt September consumer collapse.
Needless to say, if this occurs, then by year's end we could have a delfationary reading of more than -1.5% in only 4 or 5 months, which would almost certainly mean that either the existing recession is deepening, or else that after a short respite, a new recession focused on Main Street rather than Wall Street is beginning.
Looking at the tentative postive signal of the Kasriel indicator, and contrasting it with the slew of horrible, deflationary consumer and industrial data, it appears that one of three outcomes may happen: (1) it could be that one or both indicators -- either the Kasriel yield curve/money supply indicator or the deflation indicator -- is rendering a false signal; (2) the inflation rate might not decline as much or as swiftly as I expect; or (3) the surge in real money supply could be transitory (coinciding with a brief "respite").
We should dearly hope that all of the various stimulus packages succeed, and that the consumer panic brought on by the events of September (not least of which was Bush's abominable "Panic NOW!!!" speech of late September) proves transitory. There are reasons to believe that might be the case, mainly:
(1) the drastic consumer retrenchment in response to $147/barrel Oil of July will abate.
(2) Hurricanes Gustav and Ike may be responsible for the outsized downturn in September industrial production.
(3) Americans may conclude that Bush's "Panic NOW!!!" pronunciation was every bit as wrong as every other course of action he has ever proposed.
Weighing the probabilities, I consider it more likely that the M1 money supply will not continue its upward path, and will shortly decline on an annual basis to less than the inflation rate; or else that banks will hoard the Fed cash and not inject it into the economy, proving the Kasriel indicator wrong this time. Should that occur, then almost certainly the Fed will be caught in a "liquidity trap" and we will experience our first consumer-driven deflationary recession in over 70 years, in 2009. If it occurs, it will be sharp and brutal.
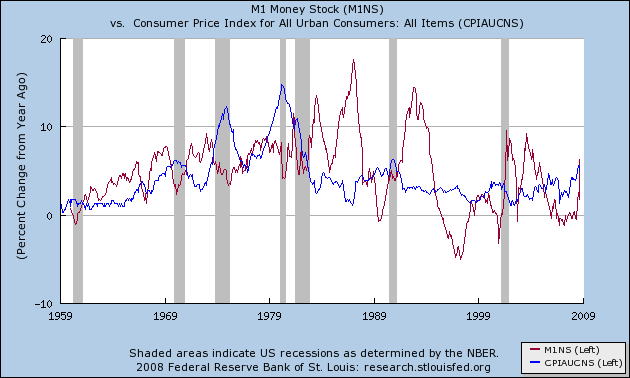
But what about inflation or even hyper-inflation, given the money supply being injected into the economy? Let's show an answer in two ways, one graphically, and one historically.
On a graphic basis, below is a graph of the consumer inflation rate (in blue) and the annual change in M1 money supply (in red). Suffice it to say, there is no simultaneous correspondence between the two. The greatest monetary stimulus of all took place in the 1980s and early 1990s, and yet inflation over that time generally declined. Any effect, if there is one, takes place with a conspicuous lag in time.
On a historical basis, the book "Bankruptcy 1995" discussed three similar such events in Latin America -- in Chile, Brazil, and Argentina -- in the 1980s. All three countries historically had high inflation rates -- low inflation for them was under 50% a year! Nevertheless, their problems all started with a real estate boom. When real estate collapsed, it dragged each economy, briefly, into a deflationary period. It was the monetary policies of the authorities trying to overcome the deflation that led to the subsequent hyper-inflations.
In our case, the relatively mild recent inflationary episodes during our housing boom appear to be collapsing. I suspect that the "Kasriel recession indicator" that I described in my previous diary as signaling that the recession "should be" over, is in fact only showing a brief "respite" as inflation rapidly transitions to deflation. If we do have a deflationary episode in 2009, I expect it to be short-lived. The frantic efforts of the authorities that have really just started may indeed lead to a more brutal inflationary episode, but if it occurs, it will be in 2010 or so, after the period of deflation.
Comments
speculation, timing
You saw the Hedge funds dumping commodities right and left (Instapopulist) so what effect and do we really know that speculation is having on commodities dropping like a stone?
Then, the dollar has been a reserve currency during this history, although this "global action" is probably helping keep that intact but there are a lot of international economists saying the US will no longer be a world economic power from all of this....so what happens then.
others screaming inflation
Oil, Gold headed higher from Seeking Alpha.
Minyanville is calling it a tug of war (in reference to gold prices but has some good info on money supply).
Both don't give timing estimates, including analysts also claiming that commodities should go through the roof, due to inflation and that seems to be key in the roller coaster ride.
BASE, St. Louis Adjusted Monetary Base
You see this?
Monetary base, speculation and inflation
The St. Louis Adjusted Monetary Base correlates well with M1 on a YoY basis. Both tell the same story of the Fed aiming a fire house of cash at the financial system, precisely to try to prevent a deflationary recession (or worse).
Keep in mind that the Euro, the Yen, and all or almost all currencies are not backed by anything other than the full faith and credit of their respective governments. Thus the ground is fertile for competitive currency devaluation.
Ultimately the firehose of liquidity will most likely give rise to a very inflationary "event" but I suspect the unwinding of the US credibility will take a generation rather than unwinding suddenly.
Has current credit scores
Has current credit scores and ratings been taken into account when comparing the historic data? It seems Americans and American companies are broke. This coupled with the fact that interest rates are at record lows, I can't see anything but deflation for quite some time.
If FICO and Appraisals are
If FICO and Appraisals are so great, how come they couldn't anticipate this meltdown? Perhaps local/regional micro-intelligence would have helped? See: http://www.homevaluepredictor.com