
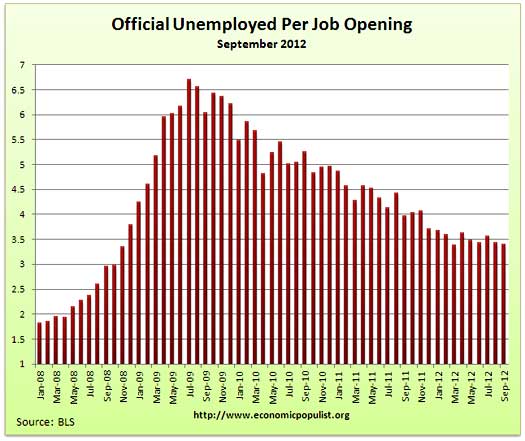
The BLS September JOLTS report, or Job Openings and Labor Turnover Survey shows there are 3.4* official unemployed per job opening. Opportunities, actual hires and layoffs were all down, showing a stagnant, dead pool job market. While openings decreased by -2.7%, actual hires declined by -5.7%. There were 3,561 million job openings for September, a -2.7% decrease from the previous month of 3,661,000. Openings are still way below pre-recession levels of 4.7 million. Job openings have increased 63% from their August 2009 Mariana Trench trough, yet real hiring is a distant memory and has only increased 14% from June 2009. There were 1.8 persons per job opening at the start of the recession, December 2007. Below is the graph of official unemployed, 12.088 million, per job opening.
This report confirms our conclusion on September's bizarre employed numbers. Simply put, less people quit or lost their jobs in September.
Job openings are all types of jobs, temporary, part-time, seasonal and full-time. Hires are U.S. citizens, permanent residents, illegal workers and foreign guest workers.
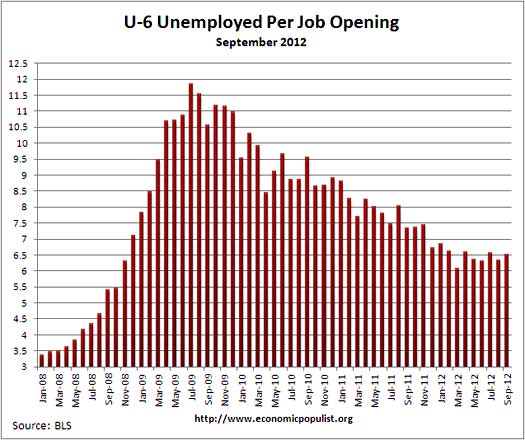
If one takes the official broader definition of unemployment, or U-6, the ratio becomes 6.5** unemployed people per each job opening. The September U-6 unemployment rate was 14.7%. Below is the graph of number of unemployed, using the broader U-6 unemployment definition, per job opening.
We have no idea the quality of these job openings as a whole, as reported by JOLTS, or the ratio of part-time openings to full-time.
The rates below mean the number of openings, hires, fires percentage of the total employment. Openings are added to the total employment for it's ratio. Openings rate dropped a 10th of a percentage point from the previous month, the hires rate, which is what is important here, dropped 0.2 percentage points. Separations declined 0.3 percentage points from August and the reason is layoffs and fires as well as people who quit their jobs declined by 0.1 percentage point. The job market is stagnant. Other separations from a job remained the same and are people who became disabled, sick, died or retired.
- openings rate - 2.6%
- hires rate - 3.1%
- separations rate - 3.0%
- fires & layoffs rate - 1.3%
- quits rate - 1.5%
- other rate - 0.3%
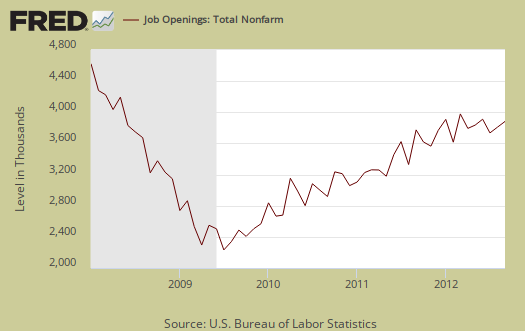
Below are raw job openings, still was below the 4.7 to 4.3 million levels of 2007 and also haven't been this low since April 2012.
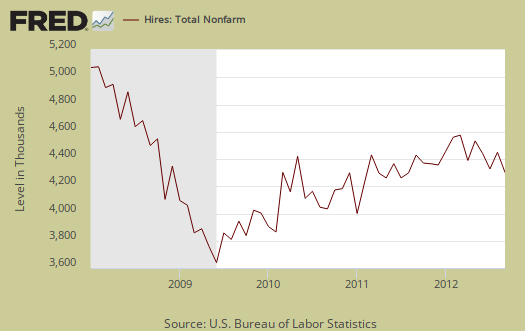
September hires were 4,185 million, an decrease of -5.7% from the previous month. Since the July 2009 trough, actual hires per month have only increased 14%. This is simply terrible as an indicator for employers are clearly refusing to increase hiring, across the board.
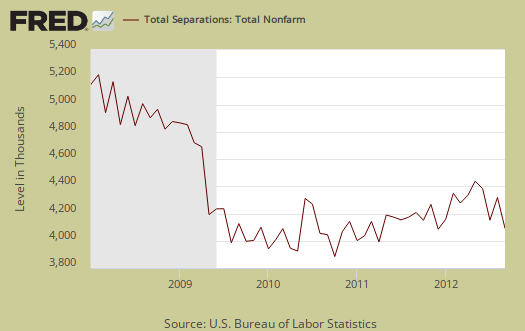
Below are total job separations, 4.024 million, a -7.6% decrease from the previous month. The term separation means you're out of a job through a firing, layoff, quitting or retirement.
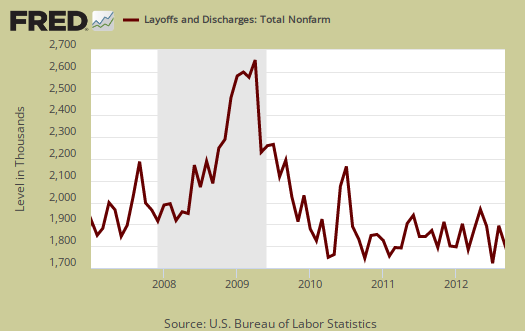
Layoffs and firings were 1.701 million for September, a -8.0% decline from August and again this explains the funky September gains in those employed. Below is a graph of just layoffs and firings.
Once again, our monotone JOLTS report looks like employment musical chairs. We have an unchanged 1.8 million overall yearly net job gain even though time marches on.
Over the 12 months ending in September 2012, hires totaled 51.6 million and separations totaled 49.8 million, yielding a net employment gain of 1.8 million. These figures include workers who may have been hired and separated more than once during the year.
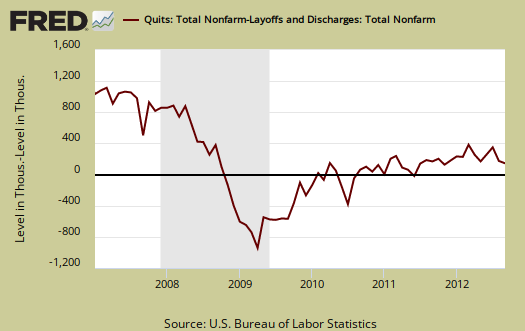
Graphed below are people who quit their jobs minus those who were fired and laid off. The lower the bar on the below graph, the worse labor conditions are. The number of quits were 1.976 million for September, a -8.1% monthly decline. People who quit their jobs are still way below pre-recession levels of 2.8 million. People are clearly not voluntarily leaving their jobs because the job market is so bad, even though the jobs slaughter of 2009 where people were laid off and fired in mass is over.
The JOLTS takes a random sampling of 16,000 businesses and derives their numbers from that. The survey also uses the CES, or current employment statistics, not the household survey as their base benchmark, although ratios are coming from the household survey, which gives the tally of unemployed.
The September 2012 unemployment rate was 7.8%.
JOLTS includes part-time jobs and does not make a distinction between part-time, full-time openings. A job opening reported to the survey could literally be take out the trash twice a week and be counted. This is a shame, it would be nice to know a little more about the quality of these new opportunities.
For the JOLTS report, the BLS creates some fairly useful graphs and they have oodles of additional information in their databases, broken down by occupational area. That said, one doesn't know if the openings are quality jobs from the JOLTS statistics. The St. Louis Federal Reserve also had loads of graphing tools for JOLTS.
Here is last month's JOLTS overview, unrevised.
*The BLS rounds up to 1 decimal place.
** is defined as the official unemployed plus people who are in part-time jobs for economic reasons plus the marginally attached. The marginally attached,
, are officially not part of the civilian labor force,
, and also not seasonally adjusted. The above graph was created by the seasonally adjusted levels of the unemployed, part-time for economic reasons and the marginally attached, raw totals. Another way to calculate this figure is:
where
Recent comments