
Q4 2013 real GDP was revised significantly downward from the original 3.2% to a weak, measly 2.4%. Personal consumption expenditures was revised down over half a percentage point of GDP. The original estimate for exports was also revised down over a quarter of a percentage point. If the Q4 downward revision in consumer spending isn't bad enough, for all of 2013 annual real GDP was just 1.9%. In 2012, annual GDP was 2.8%.

As a reminder, GDP is made up of: where Y=GDP, C=Consumption, I=Investment, G=Government Spending, (X-M)=Net Exports, X=Exports, M=Imports*. GDP in this overview, unless explicitly stated otherwise, refers to real GDP. Real GDP is in chained 2009 dollars.
This below table shows the percentage point spread breakdown of Q4 advance report and this Q4 GDP major component revision, along with their percentage point difference spread.
| Comparison of Q4 2013 GDP Component Revisions | |||
|---|---|---|---|
|
Component |
Q4 2013 Revision |
Q4 2013 Advance Report |
Spread |
| GDP | +2.38 | +3.22 | -0.84 |
| C | +1.73 | +2.26 | -0.53 |
| I | +0.72 | +0.56 | +0.16 |
| G | –1.05 | –0.93 | -0.12 |
| X | +1.22 | +1.48 | -0.26 |
| M | -0.24 | –0.15 | -0.09 |
This next table below shows the percentage point spread breakdown of Q4 from Q3 GDP major components, along with their spread.
| Comparison of Q3 2013 and Q4 2013 GDP Components | |||
|---|---|---|---|
|
Component |
Q3 2013 |
Q4 2013 |
Spread |
| GDP | +4.13 | +2.38 | -1.75 |
| C | +1.36 | +1.73 | +0.37 |
| I | +2.56 | +0.72 | -1.84 |
| G | +0.08 | –1.05 | -1.13 |
| X | +0.52 | +1.22 | +0.70 |
| M | -0.39 | –0.24 | +0.15 |
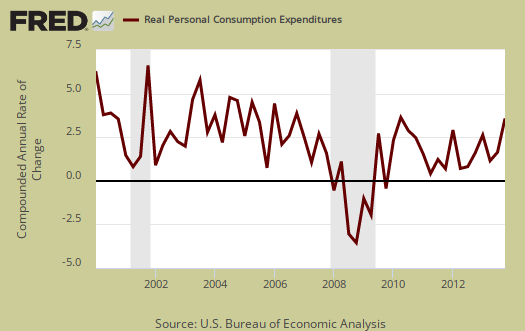
Consumer spending, C in our GDP equation, even with the revision is still over higher than Q3 PCE. Durable goods appears to be significantly revised lower to 0.19 percentage points with motor vehicles and parts going negative. Below is a percentage change graph in real consumer spending going back to 2000.
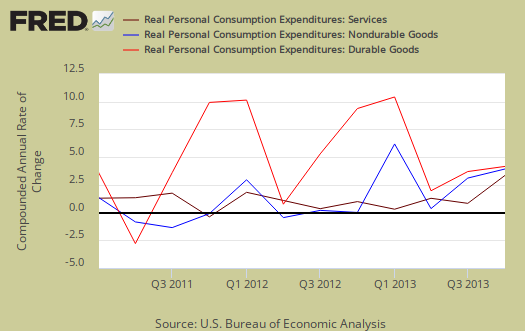
Graphed below is PCE with the quarterly annualized percentage change breakdown of durable goods (red or bright red), nondurable goods (blue) versus services (maroon).
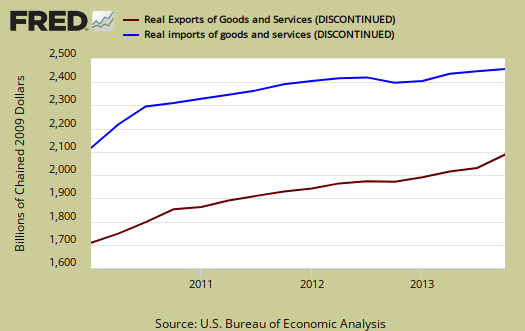
Imports and Exports, M & X even with revisions added almost a percentage point, 0.99, to Q4 GDP as exports grew much more than imports. Even with the revisions this is still a surprise showing and America increasing their exports is a very good thing. Needless to say economic activity does vary greatly from quarter to quarter so only time will tell if this is a trend.
Government spending, G was an amazing –1.05 percentage points of Q4 GDP as federal government spending contracted by –12.8%. These are budget cuts and shut downs showing the deep negative impact on the economy. Defense spending contractions shaved off –0.70 percentage points of GDP and contracted –14.4%. Below is the graph of government spending showing clearly the never ending budget cuts have been a real drag on the economy. For 2013 government spending declined by –2.3%, in 2012 -1.0% and in 2011 government spending dropped by -3.2%. All of the cutting on government spending with such weak economic demand has further stunted economic growth.

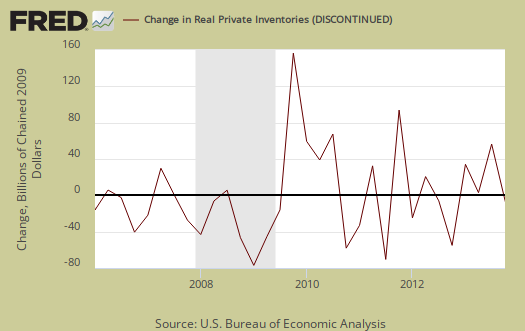
Investment, I is made up of fixed investment and changes to private inventories. The change in private inventories alone gave a +0.14 percentage point contribution to Q4, much less than Q3's 1.67 percentage point blow out. Below are the change in real private inventories and the next graph is the change in that value from the previous quarter.

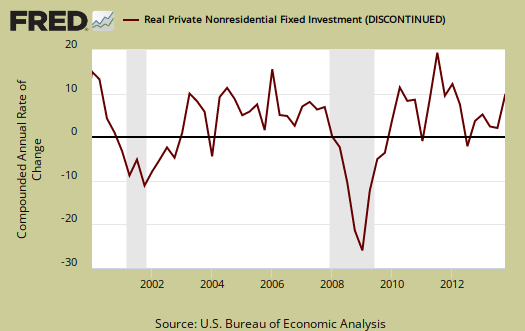
Gross private investment if fix investment plus changes in private inventories and overall contributed 0.72 percentage points to GDP. Fixed investment is residential and nonresidential and contributed +0.58 percentage points to GDP. Nonresidential was 0.87 percentage points of GDP, which was a large upward revision. Nonresidential structures by themselves was a flat line, 0.01 percentage points.
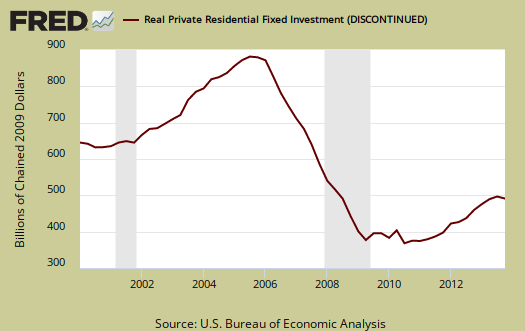
Part of fixed investment is Residential fixed investment. Residential subtracted ––0.29 percentage points to Q4 GDP. This was not revised significantly from the advance report and the negative economic growth contribution isn't surprising since other housing statistics have indicated a contraction. One can see the housing bubble collapse in the below graph and also how there is no meteoric recovery in terms of economic growth.
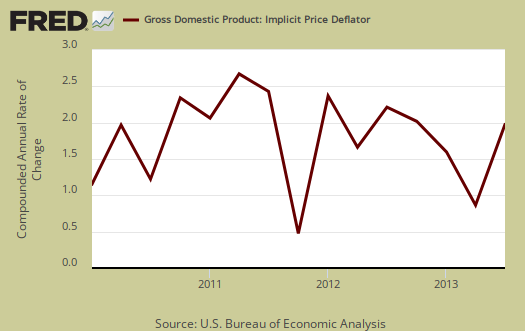
Another reason for the big decrease in Q4 GDP is the price index was 0.3 percentage points higher than originally estimated. The price index for gross domestic purchases, increased by1.5% for Q4 in comparison to 1.8% for Q3. Minus food and energy the price index increased 1.8%. For all of 2013 the price index was 1.2%. Below is a graph of the price index.
Nominal GDP: In current dollars, not adjusted for prices, of the U.S. output,was $17,080.7 billion, a 4.0% annualized increase from Q3. In Q3, current dollar GDP increased 6.2%.

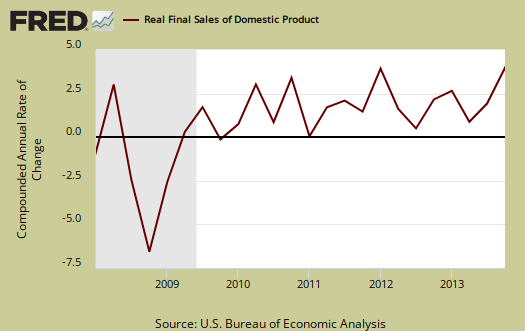
Real final sales of domestic product is GDP - inventories change. This figures gives a feel for real demand in the economy. This is because while private inventories represent economic activity, the stuff is sitting on the shelf, it's not demanded or sold . Real final sales increased 2.3%, revised down from2.8%. This is another sign there is weak demand in the economy overall. Q3 real final sales were 2.5%.
Gross domestic purchases are what U.S. consumers bought no matter whether it was made in Ohio or China.   ; It's defined as GDP plus imports and minus exports or using our above equation: where P = Real gross domestic purchases. Real gross domestic purchases increased 1.4%. Q3 was 3.9%. Exports are subtracted off because they are outta here, not available for purchase by Americans, but imports, as well a know all too well, are available for purchase at your local Walmart. When gross domestic purchases exceed GDP, that's actually bad news, it means America is buying imports instead of goods made domestically.

Below are the revised percentage changes of Q4 2013 GDP components, from Q3. There is a difference between percentage change and percentage point change. Point change adds up to the total GDP percentage change and is reported above. The below is the individual quarterly percentage change, against themselves, of each component which makes up overall GDP. Additionally these changes are seasonally adjusted and reported by the BEA in annualized format.
|
Q4 2013 GDP Component Percentage Change (annualized) |
|||
|---|---|---|---|
| Component | Percentage Change from Q3 | ||
| GDP | +2.4% | ||
| C | +2.6% | ||
| I | +4.5% | ||
| G | –5.6% | ||
| X | +9.4% | ||
| M | +1.5% | ||
Annual GDP is a sore disappointment. &nsbp;For 2013 GDP rose 1.9% where as in 2012 it was 2.8%. Other overviews on gross domestic product can be found here,
last good data on exports and imports
this report is the last one where we will have a reasonably accurate estimate of real imports and exports, because the Bureau of Labor Statistics, which had been charged with gathering the statistics on import and export prices, announced on Tuesday that they would cut the International Price Program, which had been the facility used to gather that data, due to sequestered budget cuts...
btw, i also found it odd that the growth rate for the entire year, 2013 over 2012, was unrevised at 1.9%
rjs
They have to be kidding me
By cutting the international price index, as flawed as it is, there is no way to tell what the real valued trade deficit is. Are you sure?
that's exacty what their budget notice says
2014 Budget Enacted for Bureau of Labor Statistics:
"The BLS will discontinue production and publication of its Export Price Indexes. These indexes currently are used in the production of National Income and Product Accounts and in the calculation of real Gross Domestic Product."
rjs