
The Wholesale Trade Sales & Inventories monthly report shows wholesale sales increased +0.5% from last month, and inventories decreased -0.1%. In August, wholesale inventories revised down to +0.1%. From this time last year, wholesale sales are up 15.0% and inventories have increased 11.9%.
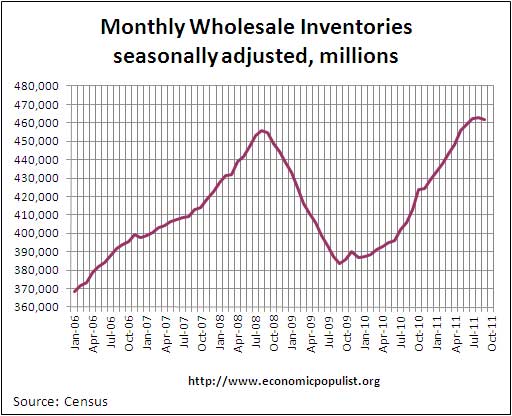
The above graph shows the deceleration in inventories during the Great Recession and a return to 2008 levels, but now a change in direction, a minor deceleration. This is good news. Businesses add to inventories when they believe their sales will increase, although sometimes they have not adjusted inventories to sales decreases, as we saw in 2008 (see sales/inventory ratio below).
The change in inventories are part of GDP growth. If you make things, even if they are sitting around in a warehouse, this represents economic activity. Q3 2011 GDP was attenuated by a deceleration in inventories.
This report only covers wholesale inventories, not all inventories, but a decline in any inventories implies less GDP growth in that area. Wholesale inventories are roughly a third of all inventories used in GDP calculations.
Wholesale inventories, seasonally adjusted, dropped -$23.92 billion from Q2 to Q3. The Q3 2011 GDP report has the change in total private inventories dropping -$42.5 billion in nominal terms.
Analysts are already shaving off 0.7 percentage points for Q3 GDP in revisions, from 2.5% to 1.6%-1.8%. We'll see, there is other data, namely PCE and trade data.
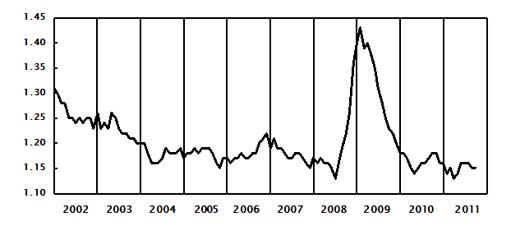
The inventory to sales ratio is 1.15, which is reasonably healthy, a sudden spike in the inventory to sales ratio implies either someone just is loading up on a large amount of inventory with the same amount of sales....or sales have dropped to the floor. Below is the graph of the monthly wholesale inventories to sales ratio, or , provided by the Commerce Department.
Regardless of dragging down GDP numbers, inventories have little to do with real demand in the economy, more an indicator of expected demand.
More details from the report:
Sales: The U.S. Census Bureau announced today that September 2011 sales of merchant wholesalers, except manufacturers’ sales branches and offices, after adjustment for seasonal variations and trading-day differences but not for price changes, were $403.1 billion, up 0.5 percent (+/-0.9)* from the revised August level and were up 15.0 percent (+/-1.2%) from the September 2010 level. The August preliminary estimate was revised downward $0.1 billion. September sales of durable goods were down 0.4 percent (+/-1.1%)* from last month, but were up 13.5 percent (+/-1.6%) from a year ago. Sales of nondurable goods were up 1.2 percent (+/-1.1%) from August and were up 16.3 percent (+/-1.8%) from last September. Sales of chemicals and allied products were up 7.8 percent from last month and sales of petroleum and petroleum products were up 3.9 percent.
Inventories: Total inventories of merchant wholesalers, except manufacturers’ sales branches and offices, after adjustment for seasonal variations but not for price changes, were $462.0 billion at the end of September, down 0.1 percent (+/-0.2%)* from the revised August level, but were up 11.9 percent (+/-0.9%) from the September 2010 level. The August preliminary estimate was revised downward $1.6 billion or 0.3 percent. September inventories of durable goods were up 0.4 percent (+/-0.4%)* from last month and were up 12.0 percent (+/-1.4%) from a year ago. Inventories of machinery, equipment, and supplies were up 2.7 percent from last month, while inventories of computer and computer peripheral equipment and software were down 2.5 percent. Inventories of nondurable goods were down 0.9 percent (+/-0.7%) from August, but were up 11.8 percent (+/-1.9%) from last September. Inventories of farm product raw materials were down 8.2 percent from last month and inventories of petroleum and petroleum products were down 4.0 percent.
Recent comments