
The April 30th GDP report issued by the Bureau of Economic Analysis ("BEA") of the U. S. Department of Commerce was a freeze-frame quarterly snapshot of a highly dynamic economy -- an economy that another source indicates was in significant transition while the snapshot was being taken.
Compared to the 4th quarter of 2009, the annualized growth rate of the GDP had dropped by 43%. Depending on your point of view this could be interpreted either as a glass that is "half-full" or a glass that is "half-empty":
1) The "half-full" reading would mean that the GDP numbers confirm that the recovery had at least moderated to a historically normal growth rate. In this scenario the good news would have been that "the economy is still growing," albeit at a historically normal rate. The bad news would have been that a normal growth rate would only warrant normal P/E ratios in the equity markets.
2) The "half-empty" reading would have meant that the near halving of the GDP's growth rate confirmed that (at the factory level) the economy had finally begun to "roll over". If so, the BEA's announcement portends even lower readings in the quarters to follow.
What was clearly missing in the "half-full/half-empty" debate was a feel for whether the level seen in the snapshot's glass was stable or still dropping. At the Consumer Metrics Institute our measurements of the web-based consumer "demand" side economy support the "half-empty" reading of the new GDP data. The new GDP numbers (which are subject to at least two revisions) agree with where our "Daily Growth Index" was on November 24th, 2009, 18 weeks prior to the end of 2010's first calendar quarter -- and when that index was in precipitous decline.
Our indexes capture consumer activities in the "demand" side of the economy by mining consumer internet tracking data on a daily basis. This consumer "demand" flows downstream economically to the "supply" side factories over the following 18 weeks:
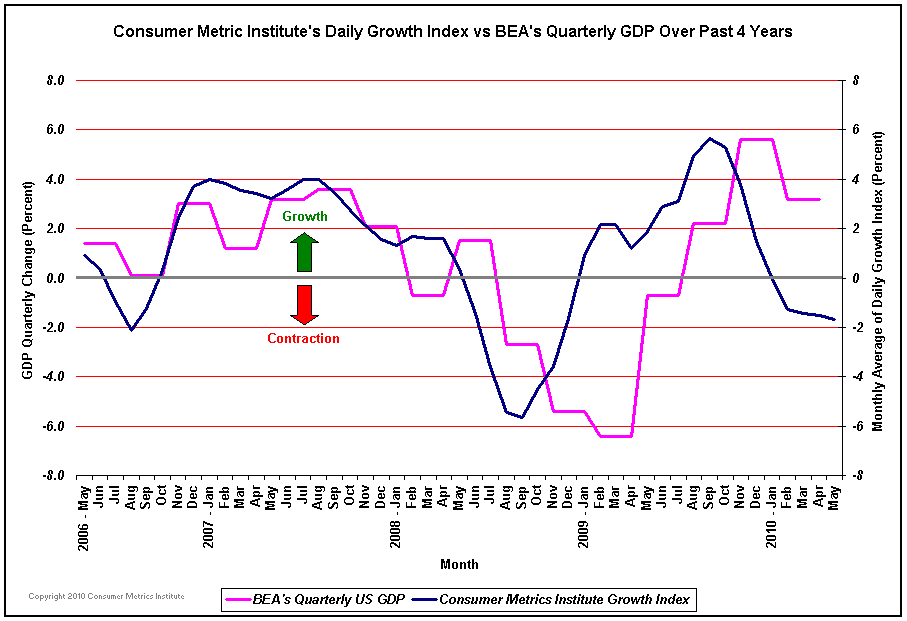
A look at our "Daily Growth Index" also shows that towards the end of November 2009 the "demand" side economic activity was dropping so quickly that a two week change in the sampling period would make a huge difference in the numbers being reported. If the sampling period had shifted to two weeks earlier, the reported GDP number would have been 4.4%, substantially higher. However, if the sampling period had shifted to two weeks later, the GDP growth rate would have been only 2.0%, less than half the reading from only 4 weeks earlier. This is the sign of an economy in rapid transition.
The methodologies used by the BEA when measuring factory production are ill suited to capturing an economy in such rapid transition. In the 4th quarter of 2009 the production side of the economy was topping (reflecting the topping of our measurements on the demand side in August 2009). The first quarter's production environment was at a much more dynamic spot in this particular economic cycle, and the subsequent monthly revisions by the BEA may be significant.
From our perspective the GDP is only confirming where our numbers were in November -- which is, relatively speaking, ancient history. Since then we have seen our "demand" side numbers slip into contraction (on January 15th), and they have recently lingered in the -1.5% "growth" range (see charts below). We have long since recorded the "demand" side activity that has been flowing downstream to the factories during the second quarter of 2010. If the GDP lags our "Daily Growth Index" by 18 weeks again we should see the consumer portion of the 2nd quarter 2010 GDP contracting at a 1.5% clip, less inventory adjustments:
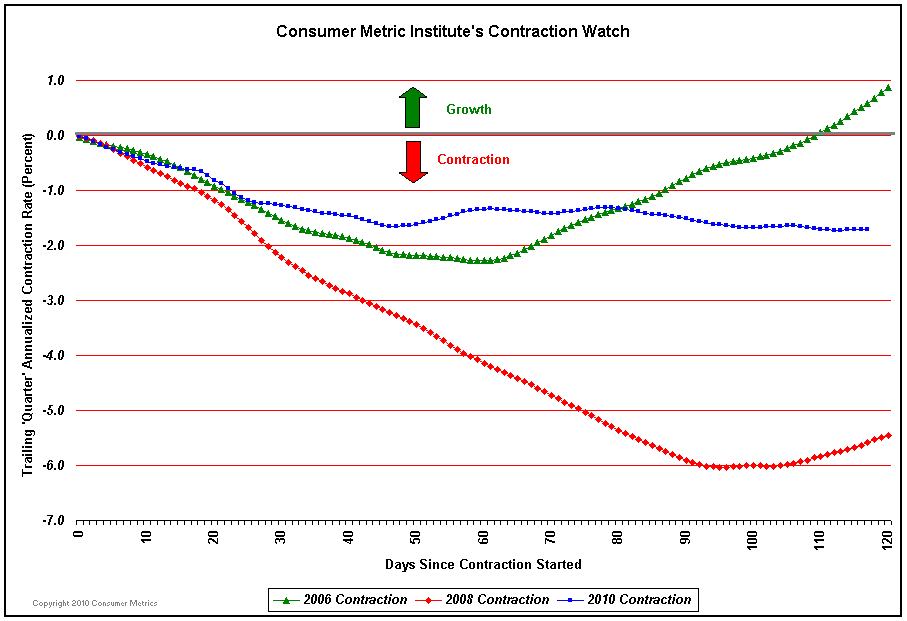
As you can see from the above chart the current consumer "demand" contraction event is unique: if there is a "second dip" it may very well be unlike anything we have seen recently. Instead of a "call-911" type of event in 2008 or the "hiccup" witnessed in 2006, we may be seeing a "walking pneumonia" type of contraction that has legs.
Our data is significantly upstream economically from the factories and the products measured by the GDP, putting us far ahead of the traditional economic reports. Perhaps our data is too timely; we are so far ahead of conventional economic measures that our story generally differs (either positively or negatively) from the stories being simultaneously reported by more traditional sources.
The indexes themselves can be found at www.consumerindexes.com.
Comments
Welcome to EP Consumer Metrics
I wouldn't claim that GDP was "half empty" or "half full" for Q4 2009 GDP was all about inventories, so in other words, I saw, at least Q4 2009 GDP numbers being a burp, vs. reflecting real economic growth via investment, exports and even our never ending, debt ridden consumer.
Here are the Economic Populist GDP reports (with graph-o-rama, courtesy of the fabulous St. Louis Fred2 Fed).
What exactly is in your indexes? Is it all real-time online data and are you capturing B2B online data? i.e. how are you collecting your sources (you can be vague, general description) and are your normalizing them? (i.e. 20% of all raw materials manufacturing is online purchase, therefore, skew the error rate by 80%, or get a normalized data path of the trend and normalize to that?) I would claim most B2B probably isn't online, then I would suspect PCE online is biased towards more affluent as well as disposable income. i.e. people do not buy gas and food online that much, whereas they do buy durable goods, but then it's going to be biased and even potentially regional.
But that depends on where you are collecting your raw data from.
Which leads to another point, if Visa/MC can know exactly what kind of beer I bought at what time, where I drank it and how long it took. i.e. behavioral market me as well as add that intel to my credit score...
then one would think we could get our government to ravamp a lot of statistics and start collecting raw real time data.
Google knows what I do since I'm online all day and probably even knows the timing of my bathroom breaks and meals due to online data. (yes folks, it's big brother, big time!)
The biggest area that I find so skewed, so "missing" is employment statistics, esp. when they get into the occupational ones, the underemployment areas and the fact they are counting foreign guest workers on temp. Visas as well as illegals in those statistics, which obviously biases it if you're looking for data on the U.S. workforce.
I think capturing online, real-time data, getting very specific, detailed transaction data and using algorithms and databases to analyze it....is really something the government agencies need to consider architecting and incorporating. Some of their results lag an entire year!
I modified your post
The site is right in the middle of major upgrades, but there is a user guide, over to the right, under your navigation, which shows you how to format links (URLs) and also how to post images, i.e. graphs. Raw links in posts is a no no, but on this site are all sorts of tools and helpers so people can "struggle less" with post formatting. You can always email me for help on this. We're supposed to be writers and looking at economics, not webbies, but that's still fundamentally the nature of the blogs, gotta know about 5 formatting tags or know how to use a WYSIWYG.
Methodology Post Coming
Robert:
Thank you for your welcoming message. I will pull together an exposition on our methodologies and make a separate post on the subject as soon as today's craziness has passed ...
Rick Davis
Consumer Metrics Institute
Rick Davis
Consumer Metrics Institute
there is a lot going on today
The audit the Fed amendment might be on today, as well as the amendment to break up the banks based on percentage of GDP. So spreading the info around isn't too bad of an idea.
then, the "dow crash" is an unanswered question happening right now.
I think online, real time data is a fantastic idea and view, but as I'm sure you are aware, macro economic raw data and not introducing bias and so is a subject area of expertise and frankly, most people do not know what GDP means never mind understanding raw data collection and statistical omissions, bias. They cannot understand seasonal adjustments for instance.
I try to add little definitions and so on in these overviews for regular folks. But hell, the White House is using Google trends lately, so getting a discussion going to make sure all are statistically valid seems to be needed.
i.e. does Google has a higher IQ user base than bing? ;) (I like Google over Microsoft, so of course I would say this one!)
Google webtends
The hot topic is Wall Street. This is what Larry Summers was using at one point in reference to the economy was improving.
http://www.google.com/trends