
The Federal Reserve's Industrial Production & Capacity Utilization report, G.17, shows a -0.1% decrease in industrial production for May 2012, a sign of more sluggishness for the economy. Manufacturing dropped -0.4%, mining and utilities increased their production, 0.9% and 0.8% respectively. Within manufacturing, motor vehicles & parts dropped -1.5% for May.
April industrial production was revised down, from +1.1% to +1.0%, with manufacturing being revised up a 10th of a percentage point to 0.7%. Mining was wildly revised from +1.6% to -0.6% and April utilities strongly revised upward, from 4.5% to a 5.8% monthly percentage increase. This report is also known as output for factories and mines.

While total industrial production has increased 4.7% from May 2011, the index is still down -2.7% from 2007 levels, that's right, five years. Here are the major industry groups yearly industrial production percentage changes from a year ago.
- Manufacturing: +5.2%
- Mining: +4.6%
- Utilities: +1.0%
Below is the Fed's description of Market groups from the report and their monthly percent changes. The report also gives annualized rates and bear in mind these are much higher than monthly percentage changes by their nature.
The production of consumer goods declined 0.2 percent in May after having climbed 1.4 percent in April. Within consumer goods, the output of durables fell 1.3 percent in May, with none of the major categories registering an increase: The production of automotive products moved down 1.9 percent; the output of home electronics was unchanged; the output of appliances, furniture, and carpeting decreased 0.5 percent; and the index for miscellaneous consumer durables declined 0.4 percent. The output of consumer nondurables edged up 0.1 percent, as a gain in the energy category was mostly offset by a decline in non-energy nondurables. The increase for the consumer energy index reflected stronger electricity sales to households and higher output of fuels. The production of non-energy nondurables declined 0.2 percent: A large decrease for paper products and a small decrease for foods and tobacco were mostly offset by a large increase for clothing and a small increase for chemical products. Over the past 12 months, the index for consumer goods has risen 2.3 percent, with the production of durable consumer goods up 11.7 percent and the output of nondurable consumer goods down 0.4 percent.
The output of business equipment rose 0.3 percent in May. Among its major components, the index for transit equipment moved up 0.5 percent, the index for information processing equipment edged down 0.2 percent, and the index for industrial and other equipment increased 0.4 percent. Over the past 12 months, the overall index for business equipment has advanced 11.3 percent, with sizable gains in all three of its major categories.
The output of defense and space equipment dropped 2.2 percent in May, in large part because of a strike at a major military aircraft facility. The index was 1.5 percent above its year-earlier level.
Among nonindustrial supplies, the output of construction supplies decreased 1.2 percent in May. After having increased 5.6 percent between October and February, the index has fallen back 1.5 percent over the past three months. The production of business supplies edged down 0.1 percent last month.
The output of materials to be processed further in the industrial sector rose 0.1 percent in May after having increased 0.6 percent in April. The output of durable materials decreased 0.5 percent in May; output moved lower for all three of its major components. The production of nondurable materials fell 0.6 percent because of losses in chemical materials and paper materials. The index for energy materials strengthened 1.1 percent mostly as a result of increases for crude oil extraction, coal mining, and electricity generation.
The breakdown of manufacturing's -0.4% monthly production decrease shows a -0.5% drop in durable goods and a -0.2% decline in nondurable goods. Primary metals dropped -1.6%, nonmetallic minerals dropped -1.1%, furniture had a -1.7%, decrease and the nebulous other manufactured goods declined -1.3%. Machinery declined -0.5%. Textiles dropped -0.7% and petroleum production increased +0.9% after last month's plunge of -3.0%. Auto & part's -1.5% May decline is no surprise since April showed an auto blow out of +4.0%.
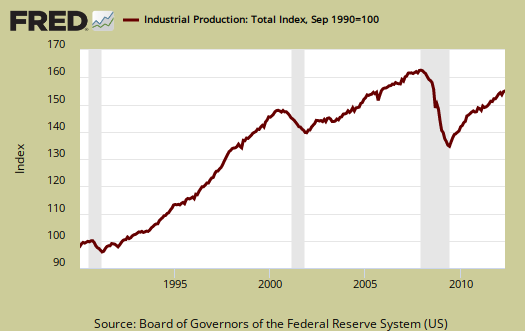
Below is another graph of industrial production since September 1990, indexed to that month. Look at the slope, the growth through the 1990's and then compare to 2000 decade. It was in 2000 when the China trade agreement kicked in and labor arbitrage of engineers, advanced R&D, I.T., STEM started in earnest.
Capacity utilization, or of raw capacity, how much is being used, for total industry is now 79.0%, 1.3 percentage points below the average from 1972 to 2011, 80.3%. Capacity utilization has increased 1.1% from May 2012, but declined -0.2% for the month. For manufacturing capacity utilization decreased -0.4 percentage points for the month to 77.6%. Manufacturing capacity is still -1.2 percentage points below it's long term average.
Capacity utilization is how much can we make vs. how much are we currently using, of what capacity is available now. Capacity utilization is industrial production divided by raw capacity.

Capacity growth is not to be confused what what is being utilized, instead this is the actual growth or potential to product. Capacity growth overall has increased only 1.0 percentage points from May 2011. Below is the capacity growth increase from a year ago and this is a contraction from last month.
- Manufacturing: +0.9%
- Mining: +1.7%
- Utilities: +2.3%
According to the report, manufacturing uses 77% of capacity, with durables and nondurables each about 50% of that. Utilities use 10.3% and mining 12.8% in 2011 (rounded) to give a ratio of manufacturing vs. mining and utilities in terms of capacity.
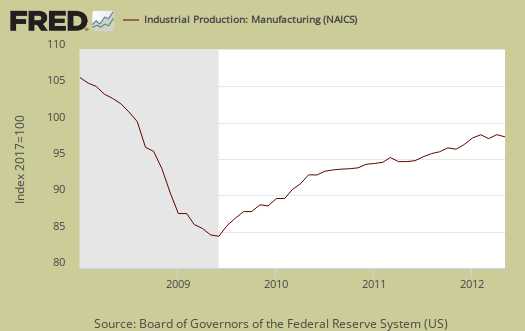
Below is the Manufacturing capacity utilization graph, normalized to 2007 raw capacity levels, going back to the 1990's. Too often the focus is on the monthly percent change, so it's important to compare capacity utilization to pre-recession levels and also when the economy was more humming.

Capacity, on the other hand, is the overall level of plants, production facilities, and ability to make stuff, that we currently have in the United States. Think about a new factory being built, or a factory shut down and it's machinery sold at auction and shipped to China. This is capacity.
The Federal Reserve releases detailed tables for more data, metrics not mentioned in this overview.
If you are baffled by what crude, finished mean from the G.17 report, read these stages of production definitions. Stages of production have implications for exports, further industrial production for finishing and since only finished goods are for final sale, what kind of output one will see for the month.
Here is our industrial production report overview from last month, unrevised.
Its The Trade Deficits
"Unfortunately, markets and policy makers are so enamored by
monetary policy solutions, they've forgotten how things are
supposed to work," which should be based on innovation and
productivity growth, Cecchini said.
Trade imbalances sank the Euro and trade imbalances across the planet will sink the world economy.
It Does Not Work.