
In several prior diaries, including Why Inflation isn't the Problem and Is the Inflation Rate Peaking I have laid out a scenario in which a deepening recession causes consumers to cut back, and this decline in demand in return causes inflation to ease. I have pointed out that this has been the scenario in every modern recession going back to and including the stagflationary "oil shock" recessions of the 1970s.
With another month's CPI and PPI data, there are signs -- albeit with substantial qualifications -- that the scenario is coming to pass. What is most interesting is that the year-over -year (NOT seasonally adjusted, AND including both food and energy) inflation rate continued to back off from its recent high water mark. Here's why....
The PPI and CPI tend to move in tandem, in that they tend to have their highs and lows for any given economic cycle almost simultaneously. Most importantly, they had simultaneous cycle highs and lows throughout the 1970s oil shock era. Here's the chart of CPI (blue) and PPI (red) for 1972-82:
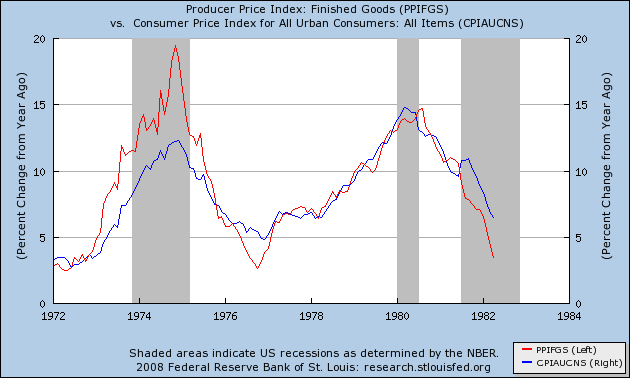
The PPI started from a cycle low in March and April 1972. The cycle low for the CPI was the next month, May 1972. Both increased in tandem to their cycle highs in November and December 1974 respectively.
Both then declined to their next cycle lows in October and November/December 1976 respectively, and then climbed to their next cycle highs in August and March 1980.
Thus, with the exception of 1980 (5 months apart), each moved in tandem to new lows and highs within 1 month of each other. Just as interesting, the maximum number of months that neither made new highs or lows within each cycle was 5 months.
During periods of time when energy prices were relatively stable, and both producer and consumer prices basically meandered around a mean, the pattern breaks down somewhat, with lengthy periods in 1984 and 1987-8 when one index would make a new 12 month high or low, and the other might not follow for a year or more.
But the pattern has largely reasserted itself since the beginning of the current secular upswing in oil prices at the beginning of 1998. Here is the same graph of PPI (red) and CPI (blue) from January 1998 to 2002:
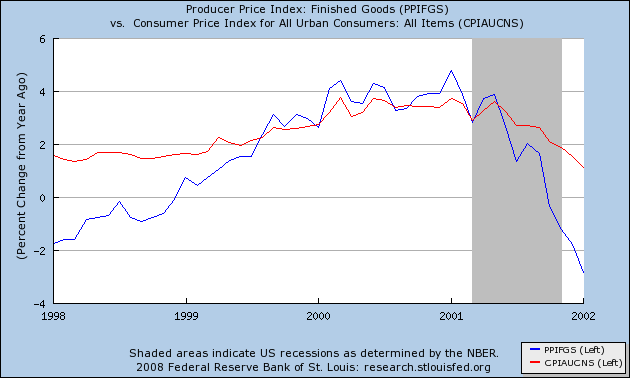
Again, both PPI and CPI made cycle lows in January and February 1998, respectively. The cycle peak for PPI was in January 2001, and while CPI peaked in March 2000 in January 2001 it came within .1% of that peak again. Both made cycle lows in January 2002.
Turning to the most recent 5 years:
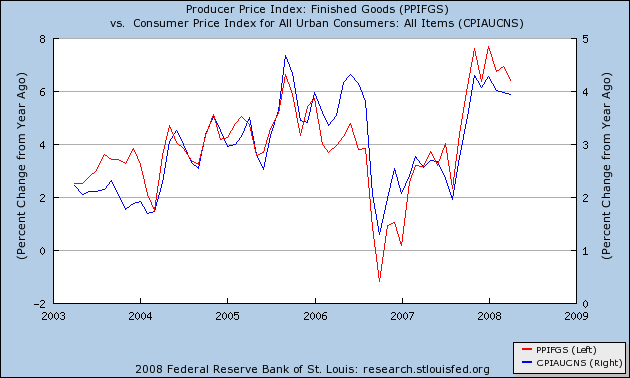
both PPI and CPI reached the next cycle peak in September 2005, before simultaneously reaching the next cycle low in October 2006.
Most recently both CPI and PPI reached peak readings in January 2008.(the CPI tying its November 2007 peak at that time).
The only exception to this pattern occurred in 2003-2004. During that period, the CPI had made an interim high in 2003 that was not confirmed by the PPI at all. Both meandered more or less sideways throughout 2004 despite reasonably dramatic increases in the price of oil. But with that sole exception, both indices made peaks and lows (within .1%) within one month of one another. Furthermore, with the exception of 2003, once again the maximum number of months that neither made new highs or lows within each cycle was 5 months.
Right now we have data 5 months past the initial CPI peak of November 2007. At that time PPI was within .1% of its January 2008 peak. Neither index has moved substantially higher since. Unless we are in an anomolous period like 2003, it is likely that the November 2007/January 2008 inflation readings were in fact the peak numbers for this cycle, or at very least peak numbers are close at hand and insignificantly higher than those readings. In short, contrary to all punditry, we may already have seen peak overall inflation for this economic cycle.
There are several important qualifications to this analysis. One is that, as I pointed out in earlier diaries, food inflation generally peaks first. Unfortunately, crude oil prices (blue) show no signs of abating, and more importantly the April food inflation (red) made a new high for this cycle:
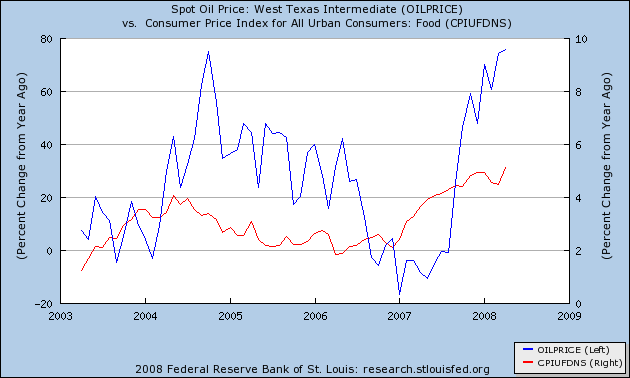
If the past pattern holds, we may yet see a higher overall inflation reading in the CPI before inflation abates.
I said in my diary last night that the forces of inflation and deflation were duking it out, with the net effect a sideways overall CPI and PPI number. That is shown in this Bloomberg chart of commodity prices (with wheat in red, corn in yellow, oil in blue and gold in, ahem, gold):
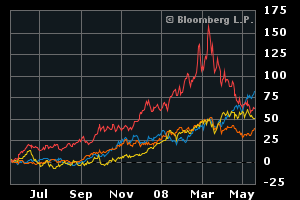
Industrial metals and agricultural prices are stabilizing or declining, and even gold has backed off of its all time highs. Needless to say, real estate related prices are declining. In that regard, my buddy bonddad has some excellent charts confirming that point up on his blog today. That makes what happens with oil all important.
Comments
oil based economy
I just don't see anything returning to cyclical while oil is shooting through the roof. I just posted in the forum new futures suggesting $150 a barrel.
Man.
Great analysis. Who does details oil analysis and what the hell is really going on? I watched the Dems blast the oil executives and so on but to me, I'm saying something pretty basic, like where are the tax breaks, incentives to in masse produce right now, super cheap, fuel efficient vehicles?
I went looking for just a pick up truck, which is pretty basic in rural areas due to the rough terrain (4WD), farms and work needs and I couldn't find a one that had anything close to decent gas mileage. Now in 1975, there was a diesel volkswagon truck that got 45 MPG, so this is absurd, the technology is out there.
Also note, the poorest people in the US, working America are also the people who use and need trucks....so of course they have the worst gas mileage.
Real or Fake Numbers?
What is the equation behind your reported CPI/PPI? I know that the government's is so far out of touch with reality as to be virtually useless; as is their unemployment statistics.
-------------------------------------
Maximum jobs, not maximum profits.
Seebert,
if you go over to John William's Shadow Government Statistics site and check out his alternate CPI, which you can find here: http://www.shadowstats.com/alternate_data
it shows the exact same peak about five months ago. For purposes of whether inflation is increasing or decreasing, vs. the absolute number, Shadow Stats or BLS stats show the same pattern. I meant to mention that in the diary, thanks for bringing it up.
Caveat emptor
There are good reasons to question Shadowstats. As I have posted here, one needs to reality-test economic statistics by asking what they predicted. In the case of Shadowstats, they predict that growth was terrible throughout the 1990s (because the official statistics would over-estimate growth by under-correcting for inflation).
But the public felt that growth was only bad from 1990-1994, which is why they threw out first GHW Bush and then the 103rd Congress. From 1995-2000, they felt that things were better, so they retained both President Clinton and the 104th/5th/6th Congress and, of course, narrowly elected Al Gore.
Granted, public sentiment doesn't follow growth precisely because of distributional issues. There are other reality tests one might use, such as business bankruptcies or other measures of economic stress. Those show steadily declining bankruptcies from 1992 onward (though with a burst of public company bankruptcies around the time of the dot com bust).
Shadowstats... caveat emptor.