
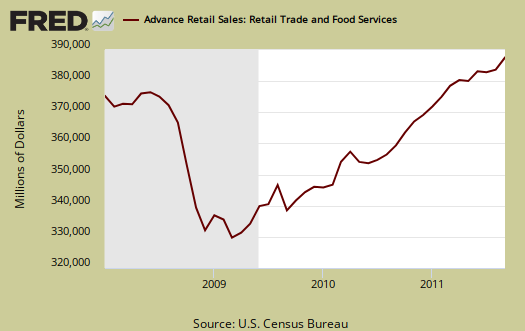
September 2011 Retail Sales increased 1.1%. August retail sales were revised up, from 0.0% to 0.3%. Retail sales are up 7.9% from the same time last year. Motor vehicle sales were up 4.0% in September and are up 8.8% from September 2010. This is better sign for Q3 GDP in terms of consumer spending, which accounts for 70% of economic growth. Retail sales are not adjusted for price increases, not reported in real dollars. Real Economic growth adjusts for inflation.
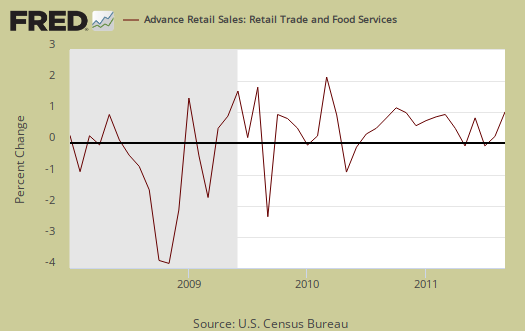
Retail sales has variance, margins of error, and is often revised as more raw data comes into the U.S. Department of Commerce. This is also the advanced report. To keep the gains in perspective, below is the graph of monthly percentage changes since 2008.
Gas sales increased +1.2% from August and are up a whopping +20.3% for the year. People spending more to fill up their tank is not much of a job creator in the U.S. Grocery retail sales decreased -0.3% and are up +5.8% from September 2010. Nonstore retailers increased +0.7% but are up +10.1% from the year previous. Nonstore retailers are online shopping, mail order, door to door. It's clear online shopping is increasing in market share.
Retail trade sales are retail sales minus food and beverage services and it increased +1.1% in September and are up +8.1% for the year. Retail trade sales includes gas.
Electronics and appliances showed signs of life with +0.2% increase for September, but for the year is no change. Furniture increased 1.1% and is up 3.2% for the year. Furniture has been negative or zero for some time, so good news for furniture stores. Department stores increased 1.1% and is up 1.0% from this time last year.
Advanced retail sales are reported three month tallies. There is variation in the monthly reported figures as well as data reporting lag. The three month tally, from July to September, is up +8.0% in comparison to the same period in 2010.
Retail sales correlates to personal consumption, which is about 70% of GDP growth. Yet GDP has inflation removed from it's numbers. This is why Wall Street jumps on these retail sales figures. Lord help them if America stops shoppin'. That said, 2010 saw poverty rates as high as 1993, and it's clear things have gotten worse since then, so where the money is going to come from so Americans can keep shoppin' is anyone's guess.
The below graph is retail sales minus autos & parts. Retail sales minus autos & parts increased +0.6% for September and is up +7.8% since this time last year.
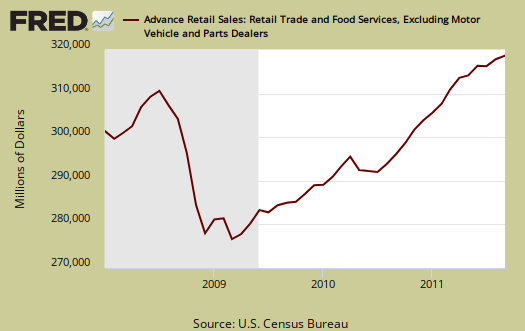
Retail minus auto & parts, food and beverages is up 1.1% for September and 8.1% for the year.
Here is last month's overview unrevised. Advance reports almost always are revised the next month.
While Wall Street cheers and this report is useful for individual retail sectors, for better macro economic indicators the personal income & outlays report gives monthly real, or adjusted for inflation, personal consumption expenditures. Basically if prices increase, so do retail sales, even if the volume remains the same.
Recent comments