
Home prices continue on their downward spiral with no relief in sight -- David M. Blitzer, S&P
It's official. Housing is in a double dip with a new low for Q1 2011, a drop of -4.2% from Q4 2010. In Q4 2010 home prices dropped -3.6%.
The National Index hit a new recession low with the first quarter’s data and posted an annual decline of 5.1% versus the first quarter of 2010. Nationally, home prices are back to their mid-2002 levels.

The above graph shows the composite-10 and composite-20 city home prices indexes. Prices are normalized to the year 2000, so the index value of 150 means single family housing prices have appreciated, or increased 50% since 2000 in that particular region. The composite-20 index has hit a new low, 138.16. It's previous all time low was in April 2009, at 139.26. For the February to March percentage change, the composite-10 index is -0.6% lower and the composite-20 is -0.8%.
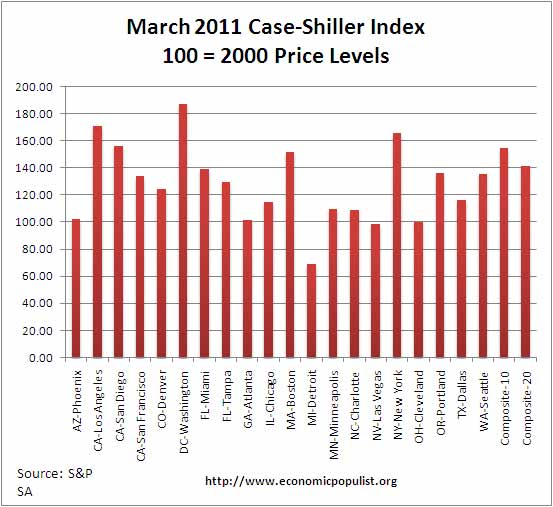
For March 2011, the S&P/Case-Shiller Home Price indexes shows 19 of the 20 cities tracked are down. 12 of the 20 city regions hit new lows as well.
Minneapolis posted a double-digit 10.0% annual decline, the first market to be back in this territory since March 2010 when Las Vegas was down 12.0% on an annual basis.
It seems the only place going up is our never ending corrupt Washington D.C. area. The report blames the tax credit, but there is only so long they can blame the home buyer's tax credit instead of the great jobs crisis and middle class squeeze. Some areas are still not affordable and out of alignment with wages and salaries, such as LA, Seattle and Portland.
Below is the yearly percent change in the composite-10 and composite-20 Case-Shiller Indices. As you can see, there is clearly a new decline going on for 2011. This is what is meant by double-dip in declining home prices.

Below is a table are all of the cities of the composite-20 index. This should give a feel for the bubble and now current devaluations. Notice the stronger correlations in price declines to the unemployment rate and lack of job growth, such as Detroit.
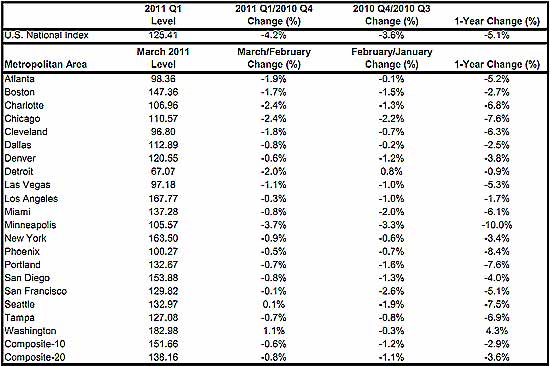
Calulcated annually, Q1 2011 dropped -5.1%, the 10-city composition dropped -2.9% and the 20-composite dropped -3.6%.
The graph below, from Calculated Risk, shows how much prices have fallen from their peaks in the Composite-10 cities. Calculated Risk has additional custom graphs and data analysis and is the uber site for residential housing data and graphs.
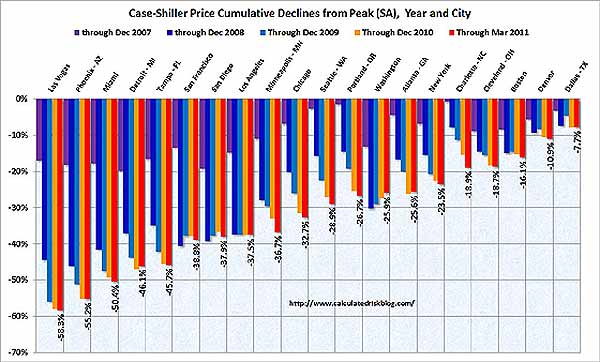
Basically a decade of home appreciation is gone. S&P does a great job of making the Case-Shiller data and details available for further information and analysis on their website.
Recent comments