
The S&P/Case-Shiller Home Price indexes for November 2010 were released today. The composite-10 index is down -0.8% for the month and the composite-20 index decreased -1.0%. For the year, the composite-10 index is -0.4% lower and the composite-20 is -1.6% lower than November 2009. Below are the 20 city and 10 city S&P/Case-Shiller monthly indices.

Home prices fell in 19 of 20 MSAs and both Composites in November from their October levels. In November, only four MSAs – Los Angeles, San Diego, San Francisco and Washington DC – showed year-over-year gains. The Composite indices remain above their spring 2009 lows; however, nine markets – Atlanta, Charlotte, Chicago, Detroit, Las Vegas, Miami, Portland (OR), Seattle and Tampa – hit their lowest levels since home prices peaked in 2006 and 2007, meaning that average home prices in those markets have fallen even further than the lows set in the spring of 2009.
Below is the yearly percent change in the composite-10 and composite-20 Case-Shiller Indices. As you can see, there is clearly a new decline going on for 2010. This is what is meant by double-dip in declining home prices.

S&P is now confirming a double dip in home prices, it's official.
With these numbers more analysts will be calling for a double-dip in home prices. Let’s take a moment to define a double-dip as seeing the 10- and 20-City Composites set new post-peak lows. The series are now only 4.8% and 3.3% above their April 2009 lows, suggesting that a double-dip could be confirmed before Spring.
Below is a table are all of the cities of the composite-20 index. This should give a feel for the bubble and now current devaluations. Notice the stronger correlations in price declines to the unemployment rate for 2010, such as Detroit.
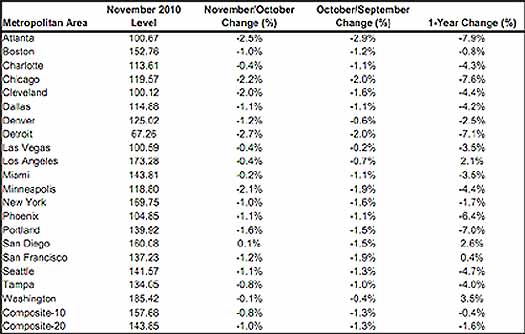
From the peak in 2006, now the 10 city index is down -30.3% and the 20 city index is down -30.3%. Nationally, prices are around the 2003 levels, with Detroit just being decimated. The increases in home prices for 2009 are quickly eroding.
As of November 2010, average home prices across the United States are back to the levels where they were in latter half of 2003. Measured from June/July 2006 through November 2010, the peak-to-current decline for both the 10-City Composite and 20-City Composite is -30.3%. The improvements from their April 2009 trough are +4.8% and +3.3%, respectively.
Below is a very useful graph from Calculated Risk, showing how much prices have fallen from their peaks in the Composite-10 cities. Calculated Risk has additional custom graphs and data analysis.
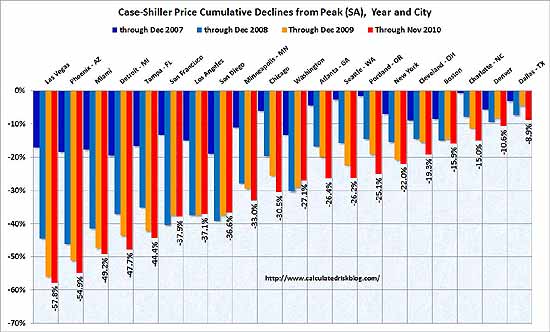
S&P does a great job of making data available for further information and analysis on their website.
Recent comments