
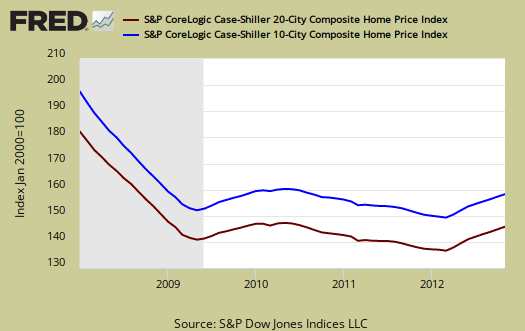
The December 2012 S&P Case Shiller home price index shows a 6.8% price increase from a year ago for over 20 metropolitan housing markets and a 5.9% change for the top 10 housing markets from December 2011. This is the highest yearly gain since July, 2006. Not seasonally adjusted home prices are now comparable to August 2003 levels for the composite-20 and October 2003 for the composite-10. Below is the yearly percent change in the composite-10 and composite-20 Case-Shiller Indices, not seasonally adjusted.

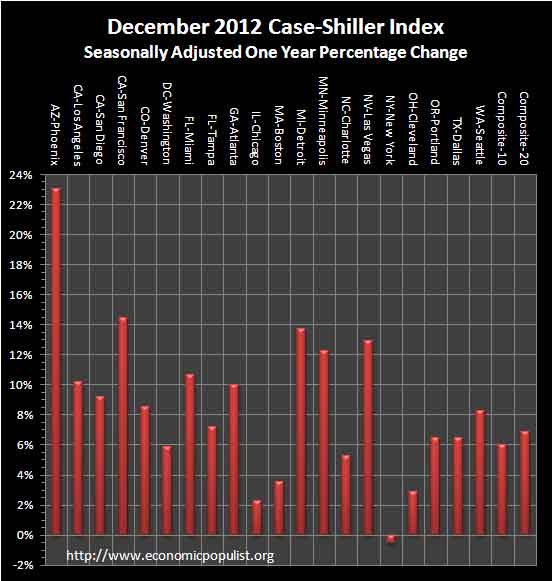
Below are all of the composite-20 index cities yearly price percentage change, using the seasonally adjusted data. Phoenix continues to soar, up 23% from a year ago and only, New York City was down, -0.51%. Atlanta has clearly hit bottom and prices have risen 10.0% from last year. This is the largest year over year increase on record for the Atlanta index. Dallas, Denver and Minneapolis also had the highest annual increases since 2001. Los Angeles is now up 10.2%, which is astounding for prices are clearly not affordable already. The seasonally adjusted price indexes show, the composite-20 yearly percentage change was 6.9% and the composite-10 yearly percentage change was 6.0% and the difference between these figures and the not seasonally adjusted ones is rounding error*.
S&P reports the not seasonally adjusted data for their headlines. Housing is highly cyclical. Spring and early Summer are when most sales occur. See the bottom of this article for their reasoning.
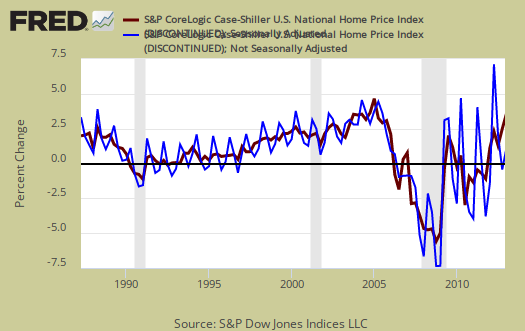
S&P also produces a third national index and is calling March 2012 a bottom for home prices. S&P is using the not seasonally adjusted national index when they report Q4 home values are up 7.3% from Q4 2011. Seasonally adjusted the quarterly change from a year ago is 7.4%. Below is the national index, not seasonally adjusted (blue), which are used as the headline numbers, against the seasonally adjusted one (maroon).

Below is the Q4 2012 percent change against Q4 2011. The seasonally adjusted change was 2.0% from Q3 2012 to Q4 2012. From Q2 2012 to Q3 2012 the change was 1.2%, seasonally adjusted. The not seasonally adjusted Q3 to Q4 2012 change was -0.3% and Q2 to Q3 2012 not seasonally adjusted change was 2.1%.

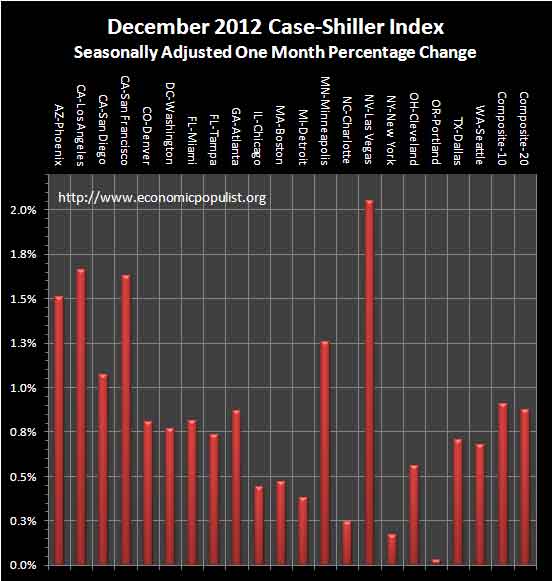
For the month, the not seasonally adjusted composite-20 percentage change was 0.16% whereas the seasonally adjusted change for the composite-20 was 0.88%. The monthly not seasonally adjusted composite-10 percentage change was 0.25%, whereas the seasonally adjusted composite-10 showed a 0.91% increase. This is winter, so it is fairly surprising how close the not seasonally adjusted and seasonal indexes are in their monthly percentage change.
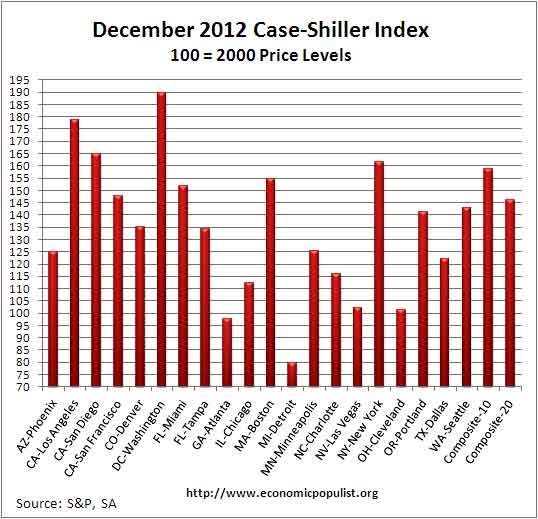
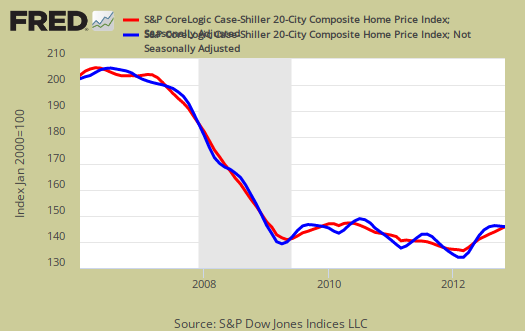
The above graph shows the composite-10 and composite-20 city home prices indexes, seasonally adjusted. Prices are normalized to the year 2000. The index value of 150 means single family housing prices have appreciated, or increased 50% since 2000 in that particular region. Only Atlanta and Detroit are below their 2000 price levels, with Detroit being 20% down from January 2000. These indices are not adjusted for inflation.
News headlines on the S&P Case-Shiller Housing Index often differ. Some in the press use the seasonally adjusted data, and others do not. Some report the monthly change, others the annual change. S&P themselves use the not seasonally adjusted housing price data. To make matters worse, some in the press do not specify which statistic they are quoting from S&P. Below are the seasonally adjusted monthly home price percentage changes for each City reported by S&P.
Below are the seasonally adjusted indices for this month. Folks spin these indexes with percentages while the index itself tells you what has happened to home prices, per city, from the year 2000. Profit makers are all about the annual change whereas homeowners who bought over a decade ago are worried about the levels and how underwater they still are with their mortgages.
S&P estimates home prices are down approximately 30% from the height of the housing bubble's June and July 2006 price peaks. These statistics use the not seasonally adjusted home price indices.
Metropolitan area housing prices are recovering and almost too much, for we assuredly do not want to return to a housing bubble. While this is great news showing the housing collapse is over and in terms of economic growth, for real working families, trying to buy a home, it's not good news. One simply cannot afford even a $200,000 mortgage when a household earns $42,000 a year, never mind a $300,000 one. Although those with underwater mortgages are probably breathing some sighs of relief. S&P warns to not expect this kind of gains in the future.
These movements, combined with other housing data, suggest that while housing is on the upswing some of the strongest numbers may have already been seen.
To Season or Not to Season, That is the Question:
The S&P/Case-Shiller Home Price Indices are calculated monthly using a three-month moving average and published with a two month lag. Their seasonal adjustment calculation is the standard used for all seasonal adjustments, the X-12 ARIMA, maintained by the Census.
So, why would S&P report the not seasonally adjusted data? According to their paper on seasonal adjustments, they claim the not seasonally adjusted indices are more accurate. It appears the housing bubble burst screwed up the cyclical seasonal pattern. What a surprise, although those steep cliff dives are now going back to 2009, one would think the seasonally adjusted data would now start to converge back to it's cyclical, seasonal pattern.
The turmoil in the housing market in the last few years has generated unusual movements that are easily mistaken for shifts in the normal seasonal patterns, resulting in larger seasonal adjustments and misleading results.
To see S&P's argument in action, look at the below graph. The maroon line is the seasonally adjusted national index, reported quarterly. The blue line is the not seasonally adjusted national index. As we can see before the housing bubble burst, we see a typical cyclical pattern difference between the seasonally adjusted and not seasonally adjusted data points. Yet after the bubble burst we see large swings, which would throw off a seasonal adjustment adaptive algorithm. This is going to become a major question among statisticians, how does one adjust for seasonality in the face of tsunami like economic events?
Not seasonally adjusted data can create more headline buzz on a month by month basis due to the seasonality of the housing market. S&P does make it clear that data should be compared to a year ago, to remove seasonal patterns, yet claims monthly percentage changes should use not seasonally adjusted indices and data. This seems more invalid than dealing with the statistical anomalies the massive housing bubble burst caused. Below is the seasonally adjusted and not seasonally adjusted Composite-20 Case-Shiller monthly index, for comparison's sake.
For more Information:
S&P does a great job of making the Case-Shiller data and details available for further information and analysis on their website.
Here is our Case-Shiller past overviews as well as the overviews of residential real estate statistics.
* S&P doesn't round in their press release. The not seasonally adjusted annual percentage change was 5.949%, the seasonally adjusted percentage change was 5.989%.
Recent comments