
The October 2016 S&P Case Shiller home price index shows a seasonally adjusted 5.6% price increase from a year ago for the 20 metropolitan housing markets and a 4.3% yearly price increase in the top 10 housing markets. Last month the annual gain was 5.4%. Home prices are still climbing over double the rate of inflation and are back up to 2007 housing bubble price levels. The U.S. National Home Price Index has also increased 5.6% from a year ago and has hit an all time high. This index covers all nine U.S. Census geographical divisions. Since the price low of March 2012, the 10-City composite index has increased 40.4% and the 20-City composite index has increased 43.1% and prices are back to winter 2007 levels. Affordability is gone with measures showing 20-30% declines since 2012.
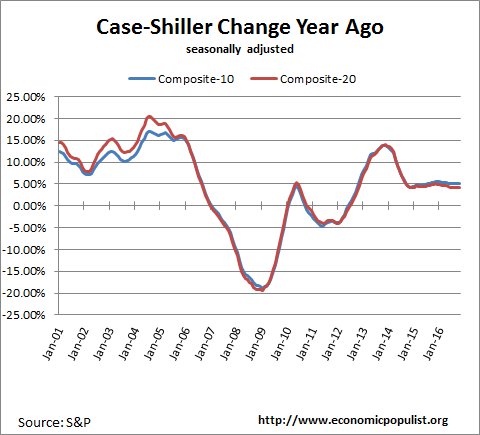
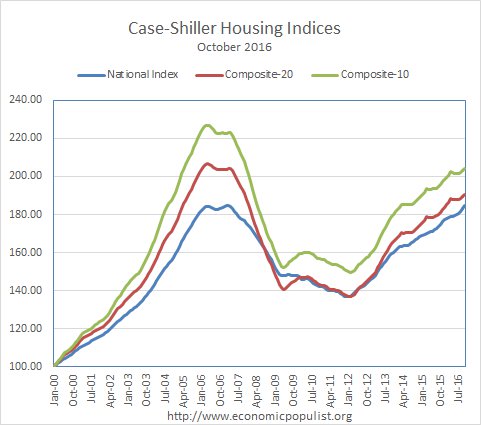
We can see below that prices on every Case-Shiller index are back to 2007 levels and thus completely unaffordable with stagnant wages and incomes. Inflation has increased but wages and incomes have barely budged. The housing bubble peak was in July and June 2006. Nationally, housing prices have surpassed that peak by 0.2%. The 20-city index is still -7.1% below and the 10-city index is -9.2% below. Yet labor participation rates are still at record lows showing millions people simply never returned to the labor force and assuredly many were not by choice.
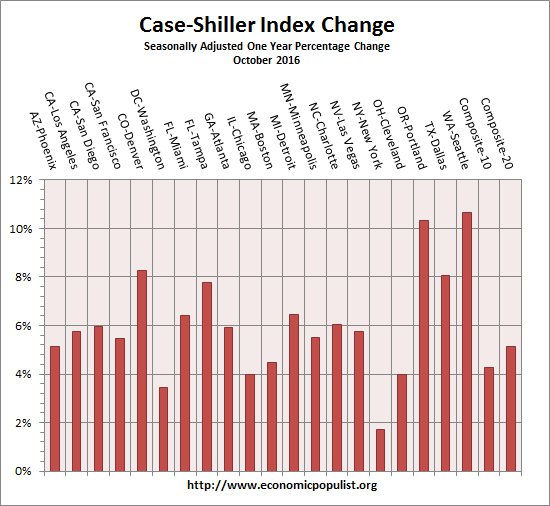
Below are all of the composite-20 index cities yearly price percentage change, using the seasonally adjusted data. The Northwest is on fire with Portland Oregon home prices increasing 10.3% and Seattle, Washington prices worse with a 10.7% annual increase. Denver Colorado prices increased over 8.3% from a year ago. Dallas Texas homes have also increased 8.1% in a year California is already sky high, one needs to be a millionaire to be a homeowner, yet prices increased in the mid five percentage range again for the year. This is so unattainable for most people, especially now with mortgage rates increasing.
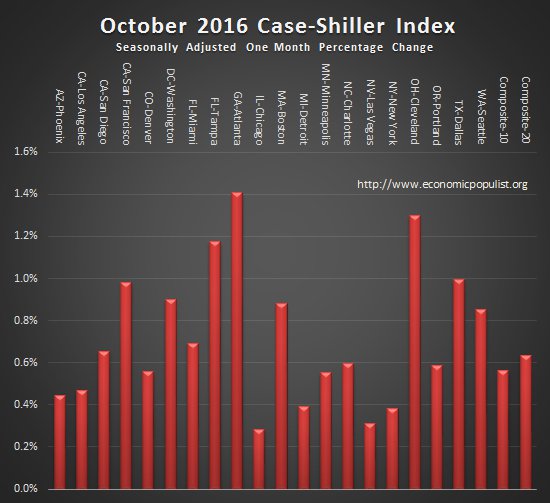
S&P reports the not seasonally adjusted data for their headlines, while this overview uses their seasonally adjusted metrics. For the month, the not seasonally adjusted composite-20 percentage change was 0.1% whereas the seasonally adjusted change for the composite-20 was 0.6%. The not seasonally adjusted composite-10 increased 0.1% from the previous month, whereas the seasonally adjusted composite-10 showed a 0.6% increase. The differences should be no surprise since October is clearly hitting the off-season for home sales. The below graph shows the seasonally adjusted monthly percentage change. Housing is highly cyclical. Spring and early Summer are when most sales occur.
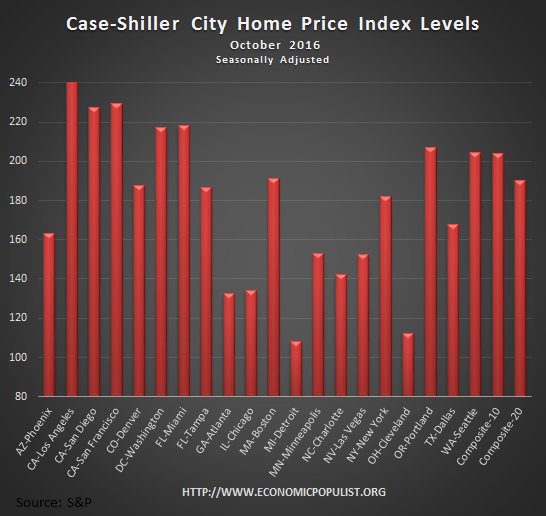
Case-Shiller home price indices are normalized to the year 2000. The index value of 150 means single family housing prices have appreciated, or increased 50% since 2000 in that particular region. Case-Shiller indices are not adjusted for inflation. Below are the seasonally adjusted levels for the month.
S&P is really commenting on the lack of housing affordability going on in the market. They claim home prices cannot rise faster than incomes and inflation indefinitely. Well, that's not quite true. If lending standards enable anyone to commit to debt way beyond their means, home prices can continue to increase. If unscrupulous foreign investors and all cash investors wish to charge outrageous rents, prices can continue to rise. Can your average American be squeezed out of the American dream? Absolutely, they already were. From the report analysis:
Mortgage interest rates rose in November and are expected to rise further as home prices continue to outpace gains in wages and personal income..
For more Information:
S&P does a great job of making the Case-Shiller data and details available for further information and analysis on their website.
Here is our Case-Shiller past overviews as well as the overviews of residential real estate statistics.
Your House as an Investment
Treating housing as an investment is artificial, bogus and economically perilous. A privately owned individual housing unit is one each unit of shelter. Its value is determined by its quality and location. It is not a source of income, commodity, stock or bond to be traded for profit. It is an integral part of living in the same category as cars, furniture, tools clothing …………… It may appreciate in price but not in value. It will always be one each unit of shelter yielding a given quality, comfort and use. Borrowing against its price to supplement income is tantamount to spending little Billy’s bedroom. Likewise moving to another equivalent or better unit of shelter and keeping out price appreciated monies is living off debt. This in reality puts one behind not ahead. Any price appreciation greater than incomes and overall inflation is artificial and built on the debt required to finance it. This has not been sustainable and is one measure of the deviation between economic views and economic realities.