
The Consumer Price Index increased 0.1% for July, which is very mild. This is in spite of a 0.9% increase in gasoline prices. Energy overall only increased 0.1%. Inflation without food or energy prices considered increased 0.1% for the month even with a 0.4% shelter cost increase. From a year ago overall inflation has increased 0.2%, which is very low. CPI measures inflation, or price increases.
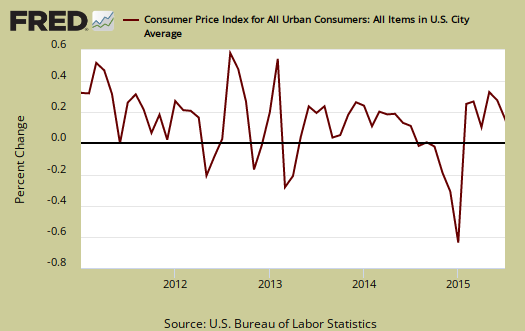
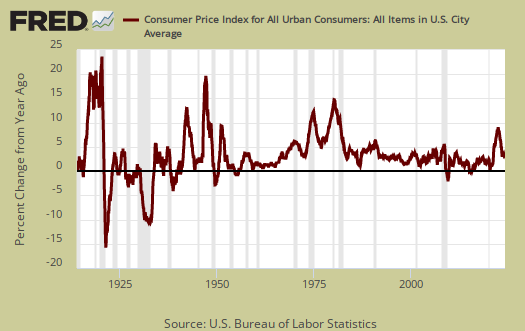
The flat yearly inflation is shown in the below graph, yet from April onward annual inflation has been increasing.
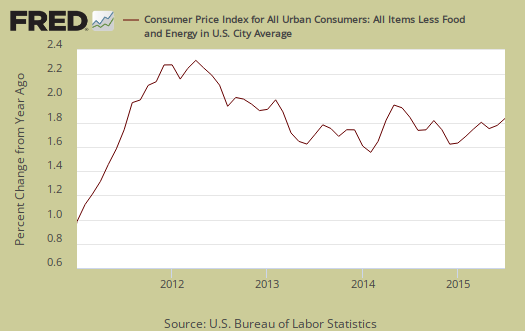
Core inflation, or CPI with all food and energy items removed from the index, has increased 1.8% for the last year. This is no change from last month. Core CPI is one of the Federal Reserve inflation watch numbers and 2.0% per year is their target rate. The Fed watches other inflation figures as well as GDP and employment statistics on deciding when to raise rates. Graphed below is the core inflation change from a year ago. For the past decade the annualized inflation rate has been 1.9%.
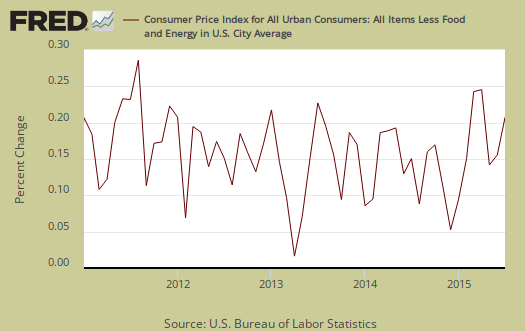
Core CPI's monthly percentage change is graphed below. This month core inflation increased 0.1%, as rents and the owner's equivalent of rent increased 0.3%. Lodging away from home, i.e. hotels, motels increased 2.5% for the month.
The energy index is down -14.8% from a year ago. The BLS separates out all energy costs and puts them together into one index. For the year, gasoline has declined -22.3%, while Fuel oil has dropped -29.7%. Fuel oil dropped -3.4% for the month. Graphed below is the overall CPI energy index.

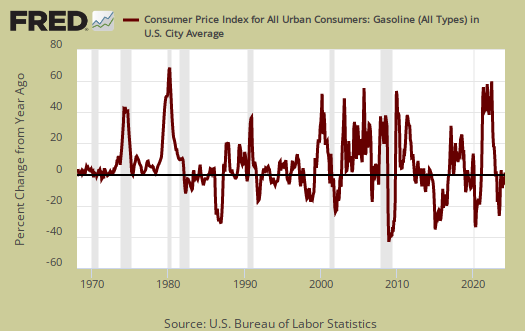
Graphed below is the CPI gasoline index only, which shows gas prices wild ride and recent increases.
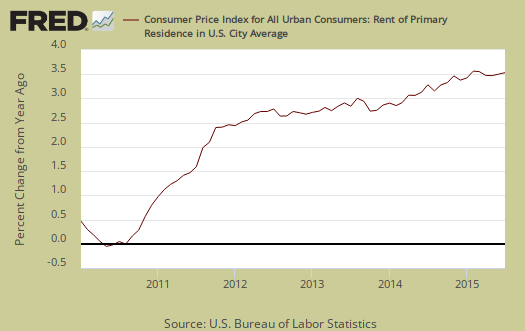
Core inflation's components include shelter, transportation, medical care and anything that is not food or energy. The shelter index is comprised of rent, the equivalent cost of owning a home, hotels and motels. Shelter increased 0.4% and is up 3.1% for the year. This is the largest increase in the shelter index since February 2007. Graphed below is the rent price index.
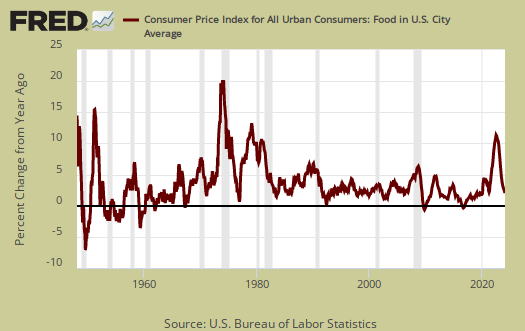
Food prices increased 0.2% for the month. Food and beverages have now increased 1.6% from a year ago. Groceries, (called food at home by BLS), increased 0.3% for the month, and are up 0.9% for the year. Eating out, or food away from home had no change.
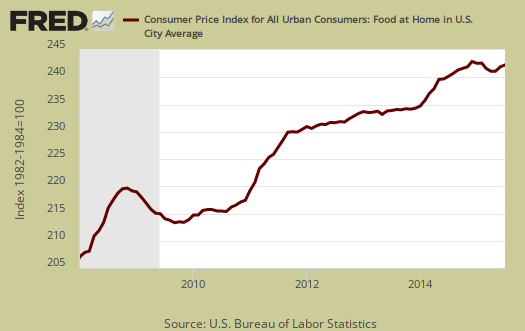
Graphed below are groceries, otherwise known as the food at home index.
Real hourly earnings increased by 0.1% for all employees. Real means wages adjusted for inflation and since CPI increased 0.3% and wages of course did not, the real value of those wages dropped. For the year real hourly earnings have increased 1.9%, for now barely staying ahead of the inflation game. The average real hourly wage is now $10.50. Weekly real earnings increased 0.5% for the month. Real weekly earnings now stand at $363.15.
CPI details
The DOL/BLS does take yearly surveys on where the money goes in the monthly budget, but as one can see, food and energy are significant amounts of the monthly finances. Run away costs in these two areas can break the bank, so can food. Additionally CPI uses substitution, so if flour goes through the roof, somehow we're all just fine with oats and prices didn't really overall increase much. Here is the BLS CPI site, where one can find much more details, information on calculation methods and error margins.
Other CPI report overviews, unrevised, although most graphs are updated, are here. If you're wondering why the graphs display different figures from the text, the graphs calculate percentages from the index and do not round. The actual data from the BLS report does round to one decimal place. In other words, 0.05% is rounded to 0.1%.
Recent comments