
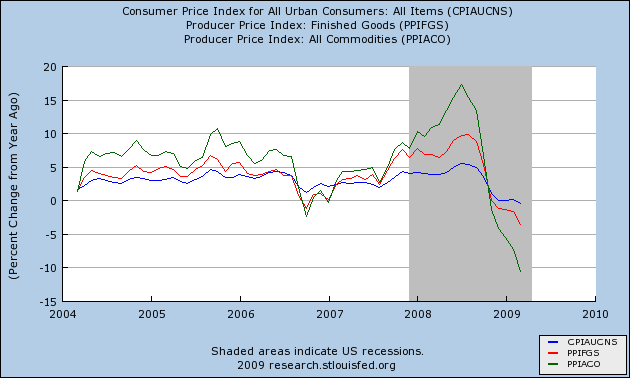
This morning the BLS reported that consumer inflation fell 0.1% (seasonally adjusted) in March, (rising 0.2% NSA) meaning that year-over-year prices have fallen -0.4% into deflation. YoY consumer deflation is only surpassed by 1949 (and ever so slightly in 1954-55) in the post-Depression era. This graph, comparing CPI with PPI for finished goods and comodities (update: showing today's CPI) shows that after a brief pause, deflationary pressures deepened - ever so slightly - in March:
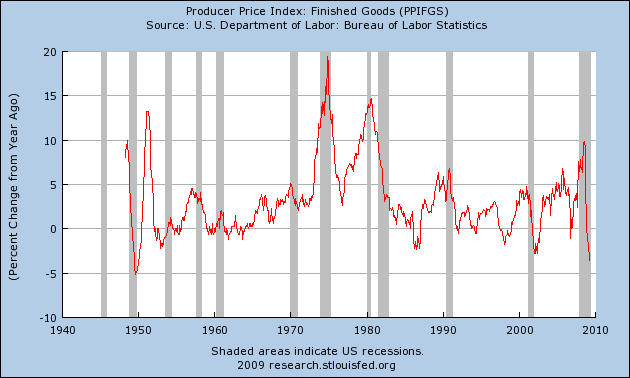
The series for Producer prices for finished goods only goes back to 1947. Only the deflation of 1949 surpasses present finished goods deflation:
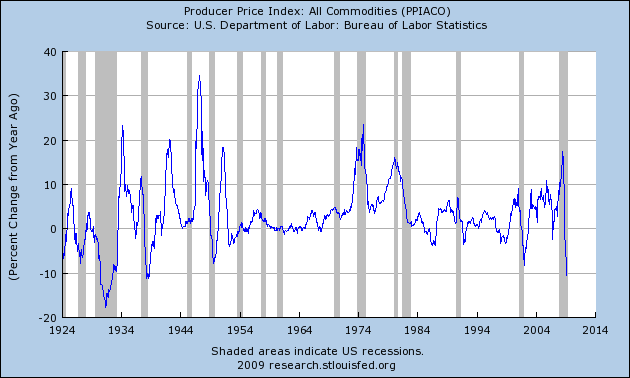
The series for commodity producer prices, however, does go back to 1913. As can be easily seen, that deflation has now surpassed anything since the Great Depression:
(Update: Ooops! Graph order originally reversed, corrected now)
Despite the steep deflation in commodity and producer prices, and the slight deflation in consumer prices, there has been no corresponding deflationary spiral in wages. Back in January I said:
we will almost certainly know in the next 60-90 days whether or not we are starting the first full-fledged deflationary wage-price spiral in over 70 years.
Well, we are 90 days later, and here is the graph for average hourly earnings through March:
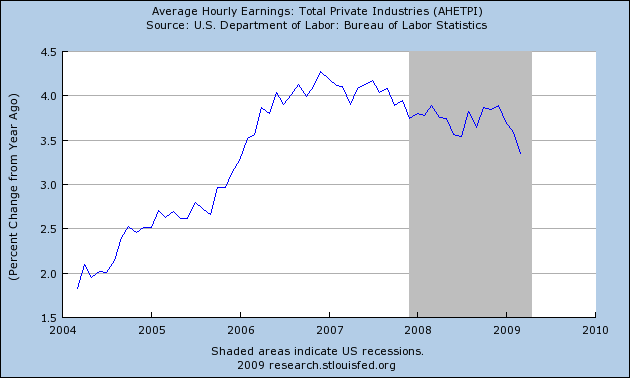
Although there have been sporadic wage cuts (especially in the deeply troubled newspaper industry), if there were to be a wage/price death spiral a la 1929=32, we would expect to see real declines in that series. This means that the ~90% of workers still employed are still a bulwark against a catastrophic Great-Depression-like meltdown.
The first quarter data is firmly in accord with the optimistic scenario I laid out in my In/Deflation outlook for 2009:
In the Optimistic scenario, the fiscal and monetary stimuli, together with intelligent new political leadership in Washington, halt the meltdown perhaps by mid-year, and wage reductions remain the exception. In the Pessimistic scenario, the stimuli fail, and wage reductions spread, leading to a wage-price deflationary spiral.
In the Optimistic scenario, monthly inflation remains positive, but perhaps at 1/3 to 1/2 the level of last year. By the end of June, first half 2009 inflation will be in the 1.4%-2.2% range. Year over year, however, as the 2008 numbers are replaced, DEflation will be realized, falling to (-2.0%) - (-2.7%) range....
In the Pessimistic scenario, monthly inflation remains near 0%-1% in the first half, and is firmly negative, though less than 2008 in the second half. By mid-year, YoY DEflation will be somewhere in the (-3%) - (-4.5%) range....
Three months later, NSA inflation for 2009 is so far at +1.1%, if anything running hotter than even the optimistic scenario. Nevertheless, if there were to be a recovery soon, we would need PPI for commodities to bottom and turn around. That hasn't happened yet. While the optimistic scenario looks more likely, we are by no means out of the woods yet.
Comments
What if the deflationary spiral in wages
is being hidden behind massively growing unemployment?
In other words, what if instead of depressing wages of those still working, we're putting other people out of work?
Eventually, that will come back around to a depression of wages, this summer when we run out of the first 6 months of unemployment.
But until then, unemployment compensation might be hiding the "other side" of the deflationary death spiral.
-------------------------------------
Executive compensation is inversely proportional to morality and ethics.
-------------------------------------
Maximum jobs, not maximum profits.
wages
You and Rob are asking similar questions, so I'll put my reply here. I don't think the "downward slope" Rob mentions, which goes to ~+2.5%/year (iirc) is that significant. During the Great Depression, for example, wages fell 40%! So a +2.5% reading in a major downturn isn't nearly the same.
To some extent, businesses have a choice of downsizing by layoffs, cutting hours, or cutting wages (or some combination thereof). So far, it appears the huge majority are choosing layoffs. While that is bad for the laid off workers, it means that the 90%+ survivors in the economy have the same, or higher, purchasing power -- which is a better base from which a recovery might occur.
I think we are at the bottom of a "ratcheting down" of the economy. We probably either go sideways ("L" shaped) or a very slow increase (Verizon "V" shaped) from here.
Given that unemployment is a lagging indicator
I think it's simply too soon to tell.
IF unemployment stops with under 20%, sure, we'll hit that L or V.
If not, we may yet see 40% deflation in wages- once companies realize that they can cut costs by laying people off and rehiring from the starving worker pool.
We may yet see a return of "will code HTML for food" signs yet.
-------------------------------------
Executive compensation is inversely proportional to morality and ethics.
-------------------------------------
Maximum jobs, not maximum profits.
Link to discussion of wage deflation
Follow this link to Prof. Brad DeLong's blog. There is a follow up by Prof. Krugman.
This discussion is two months old. The employment cost index for Q1 2009 will be released at the end of this month.
wage deflation
I don't know NDD, that sudden downward slope in the graph ...
on the 1929-1934 wage deflation, exactly how badly did that lag other economic indicators? i.e. what's the gap?
I think you're right but I'm also wondering about changes in data reporting on wages as well. I don't think back then there was this revolving "hire/fire" door that is so common now. I mean I know there were layoffs, but not this massive permatemp employment base and being outright fired, I believe you had to have done something actually wrong...
so all of that I don't think is calculated into wages, these extraneous income reduction techniques.
really great analysis. I figured you were going to cover this but not so quickly after the numbers were out!
Other variables to Consider
The wage inflation issue isn't happening in a closed system. Without wage inflation there is no demand. Demand for production of capital goods will continue to fall as states and municipalities continue to increase budget forecasts, increase public employee/legislative salaries in light of falling revenue.
The entire economic system in the United States has been built upon mathematics that require everything to get more expensive year over year, for salaries to increase, and municipalities to take more and more to feed the system. Once the numbers go negative, it breaks down.
It's easy to look at the CPI/PPI index and say "we're coming out of this slump".
But malls are closing, commercial real estate is now taking a nosedive, people are not buying new cars anyway near current production. Energy demand, smothing we were told just a year ago would get more and more expensive, never come down etc...has fallen though the floor. Demand for production is just not there.
I do hope that I'm seeing things wrong, and end up being 100% wrong. But ever since the collapse of Bear Sterns and Lehman, things I was sure could never happen have happened at an unbelievable pace.
Inflation adjusted wages
Was the chart inflation adjusted? Plus I think a longer view should be shown because from the research I've done wage stagnation has been strong since about 1970.
I also think that average wages are a bit skewed becasue the CEO type pay is included in the average. I prefer median wages. To me median wages is the 50/50 man. That person that in a crowd of 100 will have 49.5 people making more and 49.5 people making less.
These are average wages (couldn't find median for 1970)
In 1970 the average annual USA wage was $6,186.24.
http://www.census.gov/const/uspricemon.pdf
In 1970 the median home price (unadjusted for inflation) was $22,300.
In 1970 it took about four years of total wages to buy a home.
In 2007 (latest year available)the average wage was $38,760.95.
The median wage was $25,737.20
http://www.ssa.gov/cgi-bin/netcomp.cgi?year=2009
In Dec 2007 the median price was $227,700 and the average housing price was $284,400.
http://www.census.gov/const/uspricemon.pdf
In 2007 it took around 8.84 years of median wages to buy a median priced house. The median 2007 home price has gone up 1000% since 1970.
Gasoline in 1970 averaged 34 cents. In 2007 gasoline was about $2.70 a gallon. An increase of over 800%.
Oops sorry gotta go....late for an employment. Sorry I can't finish.
http://www.ssa.gov/cgi-bin/netcomp.cgi?year=2009
The national average wage index (AWI) is based on compensation (wages, tips, and the like) subject to Federal income taxes, as reported by employers on Forms W-2. Beginning with the AWI for 1991, compensation includes contributions to deferred compensation plans, but excludes certain distributions from plans where the distributions are included in the reported compensation subject to income taxes. We call the result of including contributions, and excluding certain distributions, net compensation. The table below summarizes the components of net compensation for 2007.