
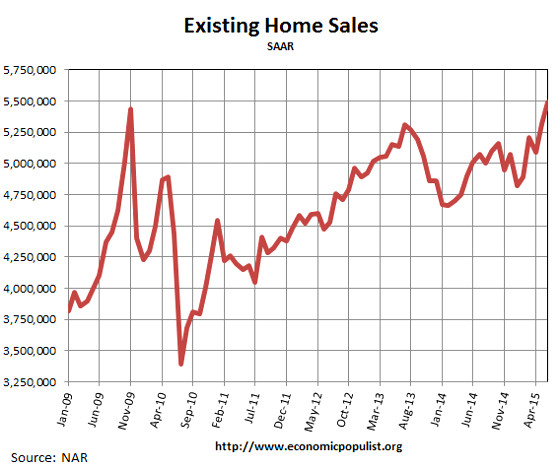
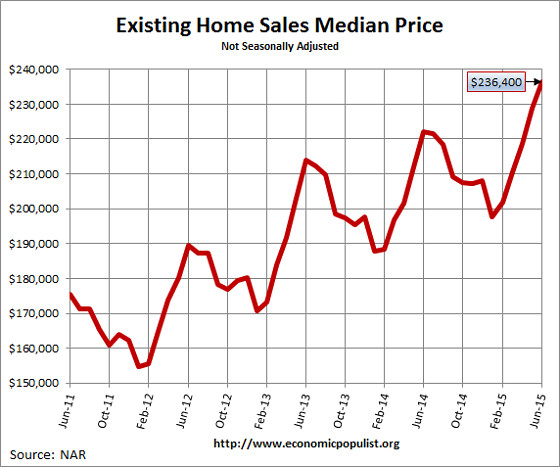
NAR's existing home sales really shot up in June with a 3.2% sales increase to 5.49 million annualized existing home sales. This is an eight and a half year high. In February 2007 existing home sales were 5.79 million. This makes sales 9.6% higher than June of last year. Existing home sales have been above their year previous amounts for six months now. Prices are clearly in unaffordable territory as the median home price just surpassed the housing bubble July 2006 peak and hit a new record.
The national median existing home sales price, all types, is $235,400, a 6.5% increase from a year ago. This is a record and beats the previous $230,400 July 2006 high. The median price has also increased for 40 months in a row. Who says the housing bubble cannot return, even when adjusting for inflation. The average existing sales price for homes in February was 280,300, a 4.6% increase from a year ago.  :Anyone see a wager increase to support these soaring home prices? Of course not. Below is a graph of the median price.
NAR Economist Yun claims it is just the improving economy and the threat of interest rates rising that has caused the increase. He did not mention soaring rents causing people to take more of a risk on buying a home.
June sales were also likely propelled by the spring's initial phase of rising mortgage rates, which usually prods some prospective buyers to buy now rather than wait until later when borrowing costs could be higher.
Distressed home sales are now only 8% of all sales, a low not seen since August of last year. Distressed sales were 11% of all sales a year ago. Foreclosures were 6% while short sales were 2% of all sales. The discount breakdown was 15% for foreclosures and short sales were a 18% price break.
Investors were 12% of all sales and 66% of these investors paid cash. This is a low in comparison to August of last year. All cash buyers were 22% of all sales, a low not seen since December 2009. A year ago all cash buyers were 32% of all existing home sales. First time home buyers were 30% of the sales.
The median time for a home to be on the market was 34 days, also a new record since NAR started tracking this in May 2011. Short sales by themselves took 129 days, foreclosures in 39 days and non-distressed homes took 33 days. Housing inventory from a year ago has increased 0.4% but is up 0.9% from the previous month. Current the 2.3 million homes available for sale are a 5.0 months supply.
On a separate note, RealtyTrac reported June foreclosures decreased by 8% for the month and are up 9% for the year. RealtyTrac reports 787,959 properties are in the foreclosure process or already bank owned.
Below is NAR's breakdown by existing home sales type and regions. The west has the most unaffordable housing consistently.
June existing-home sales in the Northeast climbed 4.3 percent to an annual rate of 720,000, and are now 12.5 percent above a year ago. The median price in the Northeast was $281,200, which is 3.9 percent higher than June 2014.
In the Midwest, existing-home sales rose 4.7 percent to an annual rate of 1.33 million in June, and are 12.7 percent above June 2014. The median price in the Midwest was $190,000, up 7.2 percent from a year ago.
Existing-home sales in the South increased 2.3 percent to an annual rate of 2.20 million in June, and are 7.3 percent above June 2014. The median price in the South was $205,000, up 7.2 percent from a year ago.
Existing-home sales in the West rose 2.5 percent to an annual rate of 1.24 million in June, and are 8.8 percent above a year ago. The median price in the West was $328,900, which is 9.9 percent above June 2014.
Here are our past overviews of existing home sales not revised.
Recent comments