
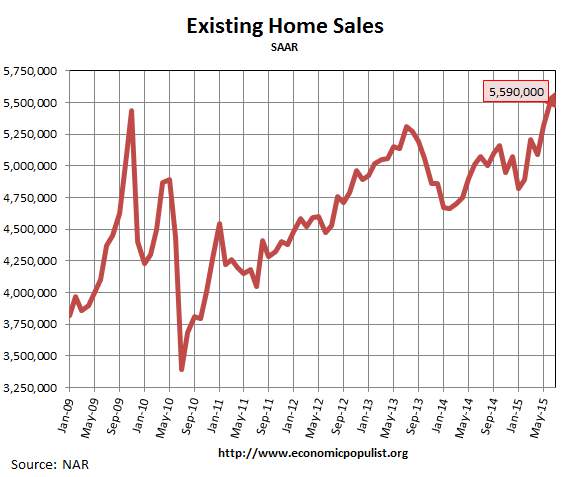
NAR's existing home sales jumped to yet another record high. Sales were up 2.0% to 5.59 million, a high not seen in over eight years. In February 2007 existing home sales were 5.79 million. Sales are 10.3% higher than a year ago. Existing home sales have been above their year previous amounts for ten months in a row now. First time home buyers just hit their lowest share of existing home sales since January, clearly being priced out and unable to meet the still strict mortgage requirements to buy. Prices are through the roof and inventories are tight.
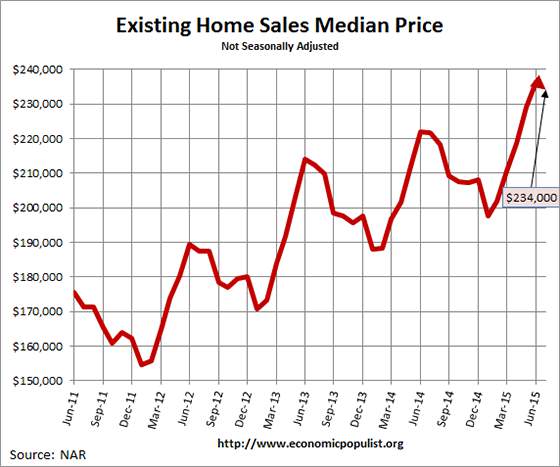
The national median existing home sales price, all types, is $234,0000, a 5.6% increase from a year ago. This is just slightly down from last month's $236,300 median price record and still beats the previous $230,400 July 2006 high. The annual median price has also increased for 41 months in a row. Even when adjusting for inflation, prices are increasing at housing bubble rates. The average existing sales price for homes in February was $278,000, a 3.9% increase from a year ago. Below is a graph of the median price.
NAR Economist Yun finally nails the obvious in his below comment.
Despite the strong growth in sales since this spring, declining affordability could begin to slowly dampen demand. Realtors® in some markets reported slower foot traffic in July in part because of low inventory and concerns about the continued rise in home prices without commensurate income gains..
Distressed home sales are at the lowest levels since the NAR started tracking on them in October 2008. Distressed sales are now only 7% of all sales. Distressed sales were 9% of all sales a year ago. Foreclosures were 5% while short sales were 2% of all sales. The discount breakdown was 17% for foreclosures and short sales were a 12% price break.
First time home buyers are really having a tough go. First time home buyers were 28% of the sales. First time home buyers were 29% of all sales a year ago. Investors were 13% of all sales and 64% of these investors paid cash. All cash buyers were 23% of all sales. A year ago all cash buyers were 29% of all existing home sales. Here is what NAR had to say about first time home buyers:
The fact that first-time buyers represented a lower share of the market compared to a year ago even though sales are considerably higher is indicative of the challenges many young adults continue to face. Rising rents and flat wage growth make it difficult for many to save for a downpayment, and the dearth of supply in affordable price ranges is limiting their options.
The median time for a home to be on the market was 42 days. Short sales by themselves took 135 days, foreclosures in 49 days and non-distressed homes took 41 days. Housing inventory from a year ago has decreased -4.7% but is down -0.4% from the previous month. Current the 2.24 million homes available for sale are a 4.8 months supply. That is -14.3% lower month's supply than a year ago, showing just how tight the existing home sales market is now.
On a separate note, RealtyTrac reported June foreclosures increased by 7% for the month and are up 149% from July of last year. RealtyTrac reports 808,047 properties are in the foreclosure process or already bank owned.
Below is NAR's breakdown by existing home sales type and regions. The west has the most unaffordable housing consistently. The west's $327,400 median price means the mortgage payment is way beyond the wages of all but 2% of the nation.
July existing-home sales in the Northeast decreased 2.8 percent to an annual rate of 700,000, but are still 9.4 percent above a year ago. The median price in the Northeast was $277,200, which is 1.3 percent higher than July 2014. In the Midwest, existing-home sales were at an annual rate of 1.32 million in July, unchanged from June and 10.9 percent above July 2014. The median price in the Midwest was $186,500, up 6.6 percent from a year ago. Existing-home sales in the South increased 4.1 percent to an annual rate of 2.29 million in July, and are 9.6 percent above July 2014. The median price in the South was $203,500, up 7.0 percent from a year ago. Existing-home sales in the West rose 3.2 percent to an annual rate of 1.28 million in July, and are 11.3 percent above a year ago. The median price in the West was $327,400, which is 8.4 percent above July 2014.
Here are our past overviews of existing home sales not revised.
Recent comments