
The NAR reported existing home sales increased 1.0% from last month and are down -0.6% from December of last year. This is the 2nd decline from from year ago, previously not seen since June 2011. Existing home sales for the entire 2013 year, on the other hand, hit housing bubble levels not seen since 2006. For all of 2013, existing home sales increased 9.1% from 2012. In 2006 existing home sales were 6.48 million. For all of 2013, existing home sales hit 5.09 million.
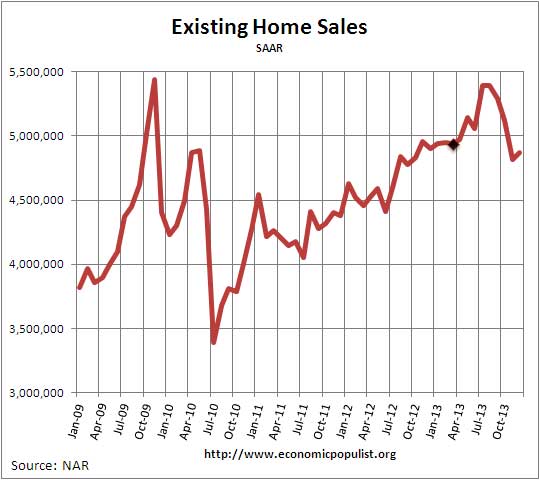
The above graph shows why existing home sales are showing declines from a year ago yet hit levels for 2013 not seen since 2006. That large bubble area for 2013 is averaged against the entire previous year, whereas we see a strong downward slide in volume and why the decline in sales in comparing December 2013 to December 2012 levels. This is why the annual total comparisons are deceptive for recently existing home sales have been flat or declining.
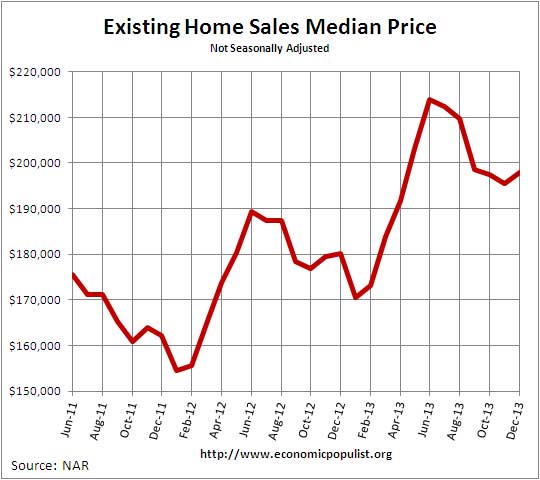
The national median existing home sales price, all types, is $198,000, a 9.9% increase from a year ago. Below is a graph of the median price. One needs to compare prices only a year ago for increases due to the monthly ups and downs in prices associated with the seasons. For all of 2013, median home prices also soared by housing bubble amounts to $197,100. This is 11.5% higher than the 2012 annual median of $176,800. In 2005 the annual median price increased by 12.4%.
The average home price for December was $246,800, a 7.0% increase from a year ago. For all of 2013 average home prices increased 8.9%.
What is more interesting is the decline in distressed home sales. Foreclosures and short sales are now only 14% in December whereas a year ago they were 24% of all sales. The breakdown in distressed sales was 10% foreclosures and 4% short sales. The discount breakdown was 18% for foreclosure sales and 13% for short sales.
So called investors are still buying up existing homes and they were 21% of all sales. All cash buyers were 32% of all sales. First time home buyers were 27% of the sales.
The median time for a home to be on the market was 72 days. December's time on the market should probably be ignored for the polar vortex shut down and delayed closings. Housing inventory remains very tight and fell 9.3% in December, yet from a year ago unsold inventory has increased 1.6%. Current 1.86 million homes available is a 4.6 months supply.
According to NAR existing home sales are up almost 20% since 2011. On a separate note, RealtyTrac showed 2013 foreclosures were up from 2012. Foreclosure and short sales were 16.2% of all residential home sales in 2013. 2012 foreclosure and short sales were 14.5% of all sales. Third party buyers at foreclosure auctions was 1.2% in 2013 while in 2013 3rd parties made up 0.8% of auction sales. This is while properties just being started in the foreclosure process is at a seven year low. RealtyTrac reports over 1.2 million properties are in the foreclosure process or already bank owned.
Below is NAR's breakdown by existing home sales type and regions. Notice the large decline in Condo sales:
Existing condominium and co-op sales fell 5.0 percent to an annual rate of 570,000 units in December from 600,000 units in November, and are unchanged a year ago. The median existing condo price was $198,600 in December, which is 10.9 percent above December 2012.
Regionally, existing-home sales in the Northeast slipped 1.5 percent to an annual rate of 640,000 in December, but are 3.2 percent higher than December 2012. The median price in the Northeast was $239,300, up 3.6 percent from a year ago.
Existing-home sales in the Midwest fell 4.3 percent in December to a pace of 1.11 million, and are 0.9 percent below a year ago. The median price in the Midwest was $150,700, which is 7.0 percent higher than December 2012.
In the South, existing-home sales increased 3.0 percent to an annual level of 2.03 million in December, and are 4.6 percent above December 2012. The median price in the South was $173,200, up 8.9 percent from a year ago.
Existing-home sales in the West rose 4.8 percent to a pace of 1.09 million in December, but are 10.7 percent below a year ago. Inventory is tightest in the West, which is holding down sales in many markets, and multiple bidding is causing it to experience the strongest price gains in the U.S. The median price in the West was $285,000, up 16.0 percent from December 2012.
Here are our overviews of existing home sales not revised.
Insatiable demand from hedge funds...
NBC: "Insatiable demand from hedge funds, private equity investors and foreign buyers, all armed with ready cash, are elbowing first-time buyers out of the housing market."
http://www.nbcnews.com/business/all-cash-offers-crushing-first-time-home...
exactly why I amplify foreclosures, investors, all cash
We did a piece of hedge funds as landlords, it's not pretty and because they are incorporated, almost no recourse for renters as they completely shirk rental law,renter's rights, which are beyond weak in most states.
median wages
if home prices are associated with median wages it is unimaginable to me that home prices can rise. The median wage has been flat or declining for the better part of 30 years, explain how home prices ca rise?
i think the northeast, where i live, has a higher foreclosure rate than the rest of the country due to the laws in these "liberal" states.
thx
yeah well
we know how people obtained homes during the housing bubble, by signing up for loans they could not possibly afford. Look at cash investors then insane places like SF, LA, D.C., etc. drive up national median price way up.