
Lender Processing Services has released their January 2012 mortgage statistics. Foreclosure starts increased 27.9% and foreclosure sales surged 29% in January 2012. We predicted foreclosures would massively increase due to the 50 state mortgage fraud settlement.
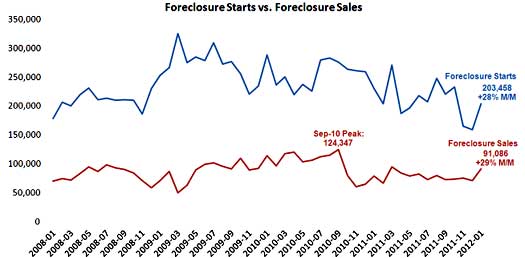
Above is the foreclosure starts and foreclosures graph from LPS Applied Analytics. Foreclosure starts were 203,458 in January whereas December 2011 foreclosure starts were 159,062. Foreclosure sales are when the bank finishes the foreclosure process and physically takes possession of the property.
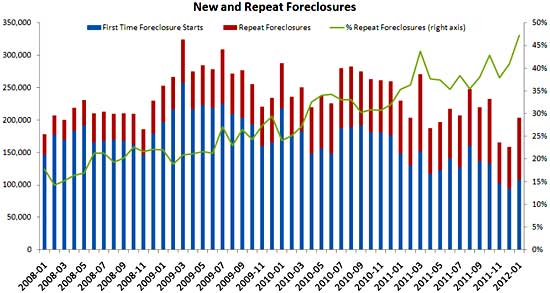
Repeat foreclosures hit an all time high and are 47% of January foreclosure starts. In other words, foreclosures that were started and then stopped were started again. This includes loan modifications that were cancelled or didn't work out.
Foreclosure inventory is now 4.15% of total active mortgages and delinquencies are 7.97%.
Those pesky judicial states, in other words, states where the court has to approve the foreclosure process, still have large backlogs, but clearly the pipeline is moving.
Despite the sharp increase in foreclosure sales, the contrast between judicial and non-judicial foreclosure states remains stark, with sales in non-judicial states outpacing judicial by over three to one. While foreclosure inventories in judicial states still far outweigh those in non-judicial, the recent surge in foreclosure sales is having a significant impact on pipeline ratios. Even in judicial states, the average pipeline ratio is now at 63 months; though still more than twice as high as non-judicial states. This is down from a high of 147 months at its peak in February of 2011.
The below Lender Processing Services press release gives the below January 2012 mortgage foreclosure and delinquency statistics. This equates to 50.217 million loans outstanding. These are first liens, i.e one loan = one property.
| Total U.S. loan delinquency rate (> 30 days past due, not in foreclosure): | 7.97% |
| Month-over-month change in delinquency rate: | -2.2% |
| Year-over-year change in delinquency rate: | -10.5% |
| Total U.S foreclosure pre-sale inventory rate: | 4.15% |
| Month-over-month change in foreclosure presale inventory rate: | 1.1% |
| Year-over-year change in foreclosure presale inventory rate: | -0.1% |
| Number of properties that are > 30 days past due, not in foreclosure: | 3,998,000 |
| Number of properties that are 90 or more days delinquent, not in foreclosure: | 1,772,000 |
| Number of properties in foreclosure pre-sale inventory: | 2,084,000 |
| Number of properties that are > 30 days delinquent or in foreclosure: | 6,082,000 |
| States with highest percentage of non-current* loans: | FL, MS, NV, NJ, IL |
| States with the lowest percentage of non-current* loans: | MT, AK, WY, SD, ND |
According to David Greenlaw, Economist at Morgan Stanley, there are 55 million homeowners with a mortgage and the breakdown for those underwater is 22%. When calculating the number of mortgages underwater, coming from CoreLogic, the total number of properties attached to residential real estate related loans becomes 48.6 million.
LPS Applied Analytics data is from more than 40 million residential real estate related loans and this is estimated to be 70% of all residential real estate related loans. They extrapolate out their statistics for the entire mortgage loan outstanding universe, estimated to be 50.17 to 50.217 outstanding first lien mortgages.
LPS Applied Analytics has more graphs and analysis at this link.
Recent comments