
The May 2013 Federal Reserve's Industrial Production & Capacity Utilization report shows no change in industrial production. Three of the last six months have shown no growth in industrial production and last month was a negative -0.4% change. For May, utilities output took a hit and declined -1.8% while mining increased 0.7%. Manufacturing showed a slight sign of life with a 0.1% monthly gain. Manufacturing has had little change so far for 2013, not a good sign. The G.17 industrial production statistical release is also known as output for factories and mines.

Total industrial production has increased 1.6% from May 2012 and is still down -1.3% from 2007 levels, going on past an incredible six years. Additionally, the annual growth is now much less than we saw in March. Here are the major industry groups industrial production percentage changes from a year ago.
- Manufacturing: +1.7%
- Mining: +4.8%
- Utilities: -3.6%
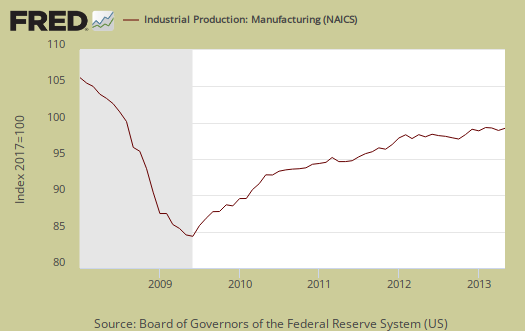
Manufacturing output alone just gave a bare 0.1% increase for May. April saw a -0.4% decline and March also declined by -0.3%. Manufacturing output has seen negative growth three of the last six months and since January 2013 growth has basically been nil. Publishing and logging are just getting hammered with a -0.4% monthly decline, the sixth decline in a row, and are also down -9.4% from a year ago. Below is a graph of just the manufacturing portion of industrial production.
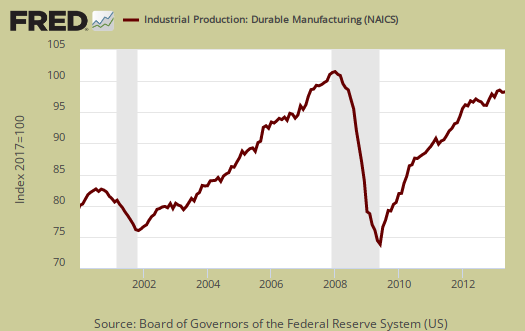
Durable goods increased 0.2% for May and from a year ago has increased 2.9%. Wood, computer & electronics both showed a 1.1% increase while primarily metals and furniture both declined -1.0%.
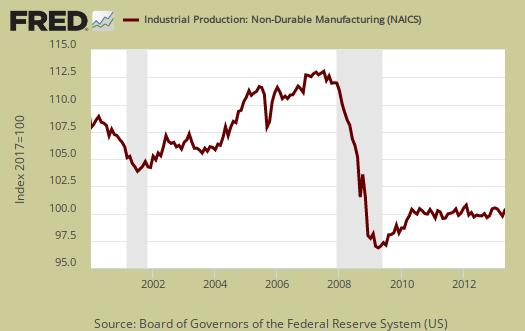
Nondurable goods manufacturing increased 0.1%, but output declined the previous two months. The gain was due to a 3.1% increase in apparel and leather. Below is a graph of nondurable goods by industry.
There are two reporting methodologies in the industrial production statistical release, market groups and industry groups. Market groups is output bundled together by market categories, such as business equipment or consumer goods. Industrial output is by NAICS codes and is for all manufacturing, or all types of durable goods manufacturing*. Below is the Fed's description of Market groups from the report and their monthly percent changes. The thing which stands out is lower sales of residential energy.
The production of consumer goods edged down 0.1 percent in May after having declined 0.7 percent in April; the index in May was 1.2 percent higher than its level of a year earlier. The production of durable consumer goods moved up 0.2 percent in May, and the output of nondurables slid 0.1 percent. Among consumer durables, the indexes for automotive products; home electronics; and appliances, furniture, and carpeting moved up, while the index for miscellaneous goods decreased. The production of non-energy nondurables edged down 0.1 percent; losses in the indexes for foods and tobacco and for paper products outweighed gains in the production of clothing and of chemical products. After having fallen 3.1 percent in April, the output of consumer energy products declined 0.2 percent further in May; a decrease in sales by utilities to residences more than offset an increase in the production of fuels.
After having declined 0.3 percent in April, the output of business equipment edged up 0.2 percent in May and was 3.3 percent above its year-earlier level. The index for transit equipment increased 0.5 percent in May, primarily as a result of an increase in the production of medium and heavy trucks, and the index for information processing equipment rose 1.2 percent, with the gain concentrated in the output of electrical instruments. Widespread declines among the components of industrial and other equipment resulted in a decrease of 0.3 percent for that market group.
The output of defense and space equipment decreased 0.7 percent in May; the index last posted a gain in December 2012.
Among nonindustrial supplies, the production of construction supplies moved down 0.2 percent in May following decreases of 1.2 percent in both March and April; output in May was 2.6 percent above its level of a year earlier. After having fallen 0.9 percent in April, the production of business supplies declined 0.3 percent in May and stood 0.7 percent below its year-earlier level.
The production of materials to be processed further in the industrial sector advanced 0.2 percent in May and was 2.1 percent above its level of a year earlier. All major components of materials posted gains in May. The output of durable materials edged up 0.1 percent, as increases in the indexes for consumer parts and equipment parts were nearly offset by a decline in the index for other durable materials. Following four months of losses, the production of nondurable materials increased 0.4 percent in May. Among its major subcategories, both textile materials and chemical materials recorded gains while paper materials was unchanged. The output of energy materials edged up 0.1 percent to post its fifth consecutive monthly increase.
Below is graph of overall industrial production's percent change from a year ago. The Federal Reserve gives long term averages but economic malaise has been going on so long, 2008-2012 are part of those averages now.

Capacity utilization, or of raw capacity, how much is being used, for total industry is 77.6%, now 2.6 percentage points below the average from 1972 to 2012. Capacity utilization has decreased -0.2 percentage points from a year ago. Manufacturing capacity utilization is now 75.8%. Manufacturing capacity utilization -0.6 percentage points lower than a year ago. These declines are not good signs folks, implying slowing projected growth or worse, they offshore outsourced production.
Capacity utilization for durable goods was an unchanged 75.9%, which is 1.1 percentage points below the long run average. Nondurable goods was also unchanged at 77.3%. Nondurable goods capacity utilization is now a whopping 3.4 percentage points below the 1972 to 2012 average.
Utility capacity utilization declined -1.4 percentage points in a month to 77.3%. The utility operating capacity rate is now a whopping -8.9 percentage points below the long term average. Mining capacity increased 0.3 percentage points, to 88.2%. Mining's operating rate is now 9 percentage points above the long term average.
Capacity utilization is how much can we make vs. how much are we currently using, of what capacity is available now, or output rate. Capacity utilization is industrial production divided by raw capacity.

Capacity growth is raw capacity and not to be confused what what is being utilized. Instead, this is the actual growth or potential to produce. Capacity is the overall level of plants, production facilities, and ability to make stuff, that we currently have in the United States. Think about a new factory being built, or a factory shut down and it's machinery sold at auction and shipped to China. This is capacity. Capacity growth overall has increased 1.9 percentage points from May 2012. Below is the capacity growth increase from a year ago of the subcategories which make up industrial production.
- Manufacturing: +1.6%
- Mining: +4.0%
- Utilities: +1.3%
According to the report for 2012, manufacturing uses 77.4% of capacity, with durables about 39.7%. Utilities use 9.9% and mining 12.7% in 2012 (rounded) to give a ratio of manufacturing vs. mining and utilities in terms of capacity. High tech uses 3.7% of total industrial production capacity. Below is the Manufacturing capacity utilization graph, normalized to 2007 raw capacity levels, going back to the 1990's. Too often the focus is on the monthly percent change, so it's important to compare capacity utilization to pre-recession levels and also when the economy was more humming.

Here are our previous overviews, only graphs revised. The Federal Reserve releases detailed tables for more data, metrics not mentioned in this overview. If you are baffled by what crude, finished mean from the G.17 report, read these stages of production definitions. Stages of production have implications for exports and imports. Finishing industrial production implies goods for final sale and thus what kind of output one will see for the month. From the report:
Capacity utilization rates in May for industries grouped by stage of process were as follows: At the crude stage, utilization increased 0.4 percentage point to 86.9 percent, a rate 0.6 percentage point above its long-run average; at the primary and semifinished stages, utilization declined 0.4 percentage point to 75.5 percent, a rate 5.5 percentage points below its long-run average; and at the finished stage, utilization edged down 0.1 percentage point to 75.8 percent, a rate 1.3 percentage points lower than its long-run average.
*From the Federal Reserve definition details:
Market groups consist of products and materials. Total products are the aggregate of final products, such as consumer goods and equipment, and nonindustrial supplies (which are inputs to nonindustrial sectors). Materials are inputs in the manufacture of products. Major industry groups include three-digit NAICS industries and aggregates of these industries-for example, durable and nondurable manufacturing, mining, and utilities./blockquote>
Recent comments