
The Federal Reserve Industrial Production & Capacity Utilization report shows industrial production had a 0.1% increase for September. Manufacturing production by itself increased 0.2%. The bigger news is industrial production has declined by -1.0% for the year and manufacturing by itself had no annual growth. Q3 by itself brought better tidings as industrial production rose an annualized 1.8%. This is the first quarterly increase since Q3 2015. The G.17 industrial production statistical release is also known as output for factories and mines.
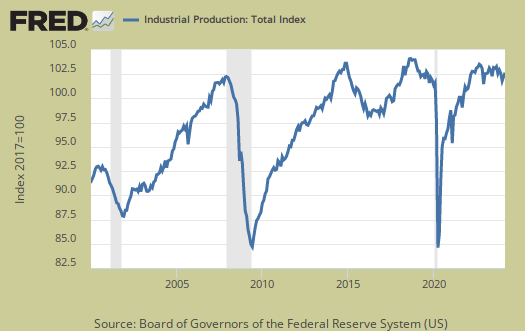
Total industrial production is below -1.0% from what it was a year ago, mainly on the implosion of oil and gas September industrial production was 4.2 percentage points above the 2012 average. Industrial production is still way below the very long term 1972-2015 average by -4.6 percentage points. Below is graph of overall industrial production's percent change from a year ago. Industrial production is a recession indicator and follows the grey recession bars.

Here are the major industry groups industrial production percentage changes from a year ago. While mining looks bad, it increased an annualized 3.7% for Q3, the first gain in six quarters.
- Manufacturing: 0%
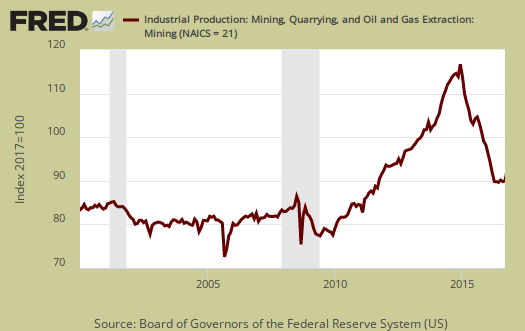
- Mining: -9.4%
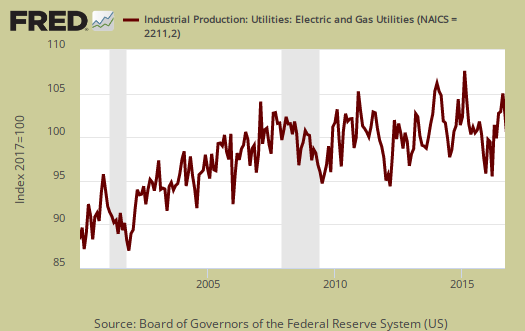
- Utilities: -0.4%
For the month manufacturing overall increased by 0.2%. August saw a -0.5% decline while July showed a 0.4% increase. Manufacturing output is 3.1 percentage points above its 2012 Levels and is shown in the below graph.

Within manufacturing, durable goods had no change at all. Machinery dropped -0.6% and Aerospace declined by -1.4%. Motor vehicles & parts increased 0.1% for the month. Primary metals, on the other hand, declined by -0.7%.

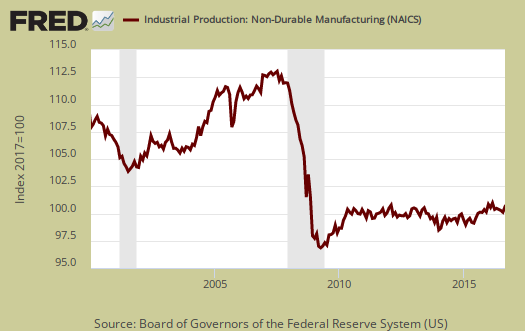
Nondurable goods manufacturing increased 0.5% for the month. Petroleum and coal products categories increased 1.4%. The Plastics and rubber category had a 1.0% monthly increase. Printing and support increased by 1.5%.
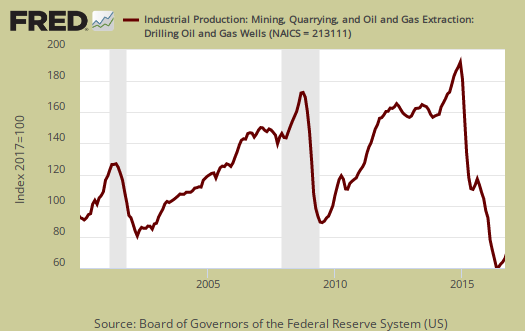
Mining increased by 0.4% and is now down -9.4% for the year. August's monthly change was -1.0% but for Q3, there was a 3.7% annualized gain after six quarterly losses in a row. Mining includes gas and electricity production and oil and gas extraction increased 5.1% for the month and looks like it is growing again with output gains the last for months. Oil and gas drilling is still down -40.3% from a year ago. Coal mining increased 1.8%.
Below is oil and gas well drilling to show the incredible bust in production and what looks to be at least a bottom, if not a turn around.
Utilities decreased by -1.0%. Utilities are often volatile due to changes in weather, as shown below.
There are two reporting methodologies in the industrial production statistical release, market groups and industry groups. Market groups is output bundled together by market categories, such as business equipment or consumer goods and shown below:
The output of consumer goods rose 0.2 percent in September. The production of consumer durables advanced 0.6 percent, with nearly all of its major components recording increases. The index for consumer non-energy nondurables moved up 0.2 percent, reflecting gains for chemical products and clothing, but the output of consumer energy products dropped 1.0 percent. Business equipment posted a decline of 0.2 percent as a result of decreases for both transit equipment and information processing equipment. The output of defense and space equipment moved down 0.4 percent. Construction supplies and business supplies each recorded an increase of about 3/4 percent in September that partially reversed a larger loss in August. The production of materials fell 0.2 percent in September, as declines in durable materials and energy materials outweighed a gain for nondurable materials. The decrease for durable materials reflected reductions for both consumer parts and equipment parts. The improvement for nondurable materials was broadly based.
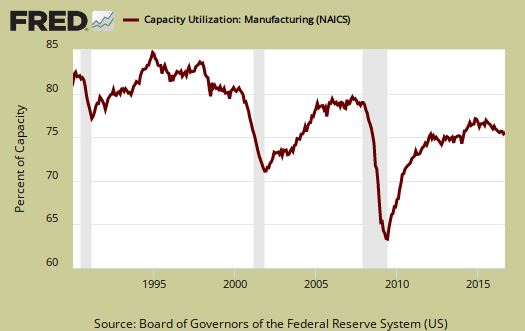
Capacity utilization, or how much raw capacity being used, for total industry is 75.4%, an increase of 0.1 percentage points from last month. . Capacity utilization has decreased by -1.0 percentage points from a year ago and is 4.6 percentage points below the long run average. This is just kind of sad and shows industry is just not humming along. Manufacturing capacity utilization increased 0.1 percentage points for the month, is 74.9% and is 3.6 percentage points below it's long run average. Mining capacity utilization jumped by 5.0 percentage points to 75.5%. Mining capacity is still down by a full -5.5 percentage points from just a year ago and is down -11.8 percentage points from mining's long term average. Utilities use of it's capacity is 79.1% and this a monthly drop of -0.9 percentage points.
Capacity utilization is how much can we make vs. how much are we currently using, of what capacity is available now, or output rate. Capacity utilization is also called the operating rate. Capacity utilization is industrial production divided by raw capacity.

Capacity growth is raw capacity and not to be confused what what is being utilized. Instead, this is the actual growth or potential to produce. Capacity is the overall level of plants, production facilities, and ability to make stuff, that we currently have in the United States. Capacity growth overall has increased 0.4 percentage points from a year ago. Below is the capacity growth increase from a year ago of the subcategories which make up industrial production.
- Manufacturing: +0.7%
- Mining: -2.9%
- Utilities: +0.7%
Below is the Manufacturing capacity utilization graph and notice how the 2001-2003 time frame starts to slide as manufacturing goes offshore in a series of bad trade treaties.
Overall while this month's report while officially OK just seemed disconcerting. Manufacturing just seems to get revised down and just never seems to really get off of the ground. The capacity figures are scary while officially the economy is supposedly doing just find. It does look like mining's free fall is over and the bottom has been hit, but recovery might be another matter. Here are our previous overviews, only graphs revised. The Federal Reserve releases detailed tables for more data, metrics not mentioned in this overview.
Recent comments