
Initial weekly unemployment claims increased to 445,000 this week. Remember when on December 30th, Initial Jobless Claims dropped below 400,000? Looks like it was a fluke, an anomaly, as originally thought. Initial weekly unemployment claims is a volatile number, subject to revisions.
From the jobless claims report:
In the week ending Jan. 8, the advance figure for seasonally adjusted initial claims was 445,000, an increase of 35,000 from the previous week's revised figure of 410,000. The 4-week moving average was 416,500, an increase of 5,500 from the previous week's revised average of 411,000.
That said, this is the release from the previous week, not revised:
In the week ending Jan. 1, the advance figure for seasonally adjusted initial claims was 409,000, an increase of 18,000 from the previous week's revised figure of 391,000. The 4-week moving average was 410,750, a decrease of 3,500 from the previous week's revised average of 414,250. .
Every week, the previous weekly initial unemployment claims is revised and it's always revised to an increase. That's not a paranoid BLS conspiracy, it is because the numbers of initial unemployment reports from states dribbles in. So, last week was only revised up +1,000, to imply a change of +36,000 increase in weekly unemployment claims.
Regardless, this is the wrong direction for unemployment claims to go.
The 4 week average, now at 416,500, has incorporated in it the December outliner data point of a 388,000 weekly report, so now the 4 week moving averages isn't giving so accurate of a picture.
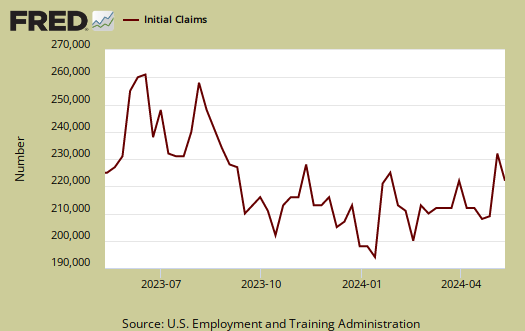
Below is the mathematical log of initial weekly unemployment claims, so one can get a better sense of the rise and fall of the numbers. A log helps remove some statistical noise, it's kind of an averaging. As we can see we have a step rise during the height of the recession, but then a leveling, not a similar decline. We have this yo-yo bobblehead, over 400,000 every week on initial claims, never ending labor malaise.
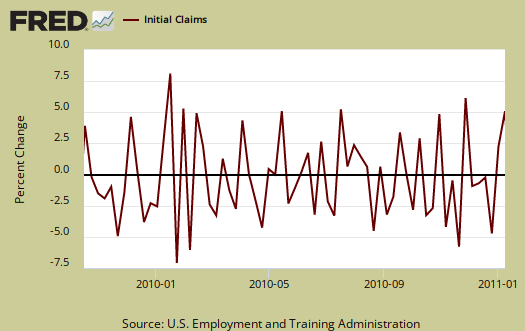
Below is a graph of the percent change in initial weekly unemployment claims for the last year. Look at how the numbers change bobs around zero, up and down, like a yo-yo.
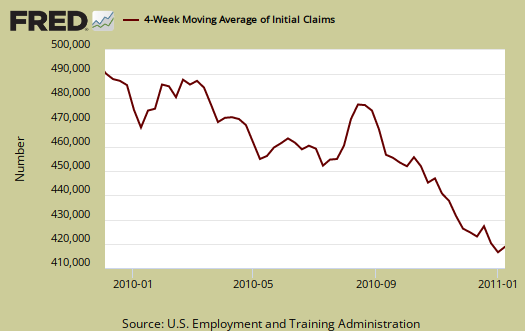
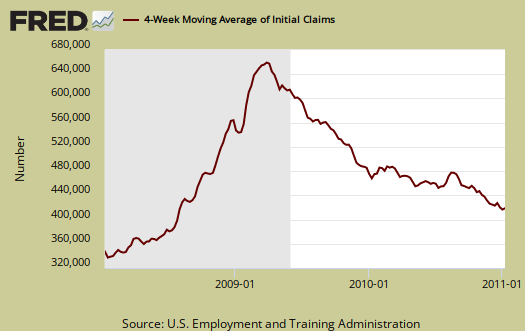
Below is the 4 week moving average, set to a logarithmic scale to remove even more statistical noise, for the last year. Here a trend that is certain would appear. It looks like we have a start, but keep your fingers crossed, wait and see. Again, we need this metric to drop below 400,000 and keep dropping. Numerous economists say the number is 375,000 to show job growth. We see a strong decline, but then again, hasn't everyone in America been fired by now?
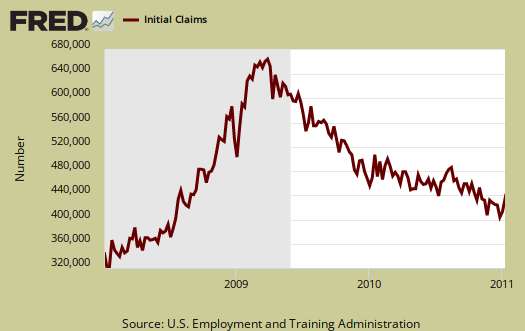
Below is a 2 year view of the 4 week moving average, set to a log scale.
In the week ending December 25th, there were 9,193,838 official people obtaining some sort of unemployment insurance benefit. That's an incredible number and doesn't include all of the people who ran out of their benefits and still couldn't find a job, it's just the people getting something right now.
Recent comments