
The surprising report of this past week was the headline drop in new housing starts during June, from a seasonally adjusted annual rate of 928,000 units in May, to an estimated annual rate of 836,000 in June, a 9.9% decline and the lowest level in a year. But as we know, the census reports on new housing are derived from a small sampling of permits offices and road canvasses by census field reps and hence have the largest margin of error of any widely watched economic releases, so we'd better take a closer look at where the headlines are coming from...
The Census report on June New Residential Construction indicates that June housing starts were "9.9 percent (±11.4%)* below the revised May estimate of 928,000", and that asterisk points us to a footnote which says in part that if the range contains zero, which it does, it is uncertain whether there was an increase or decrease in new home starts. Reading a bit more we see that range is describing the 90% confidence interval; in other words, what that 9.9% ± 11.4% means is that based on their slim sampling, census is 90% confident that the number of new home starts in June, if seasonally adjusted and projected over an entire year, would result in something between 730,336 and 941,920 residential units being started over a year’s time. Their estimate on single family starts has an equally wide range of likely starts; single family home starts are reported down 0.8% (±11.0%)* from the revised May estimate of 596,000; which means there's a one in ten chance that the annual rate of single family starts in June was greater than 656,792 or less than 525,672. Similarly, the year over year range of starts, 10.4 percent (±14.9%)* above last year's rate of 757,000, includes zero and an asterisk, meaning that with the data at hand, Census cant even be 90% confident that new home starts actually rose from a year ago...
The actual monthly estimates of new home starts by census field reps from which these seasonal adjusted annual rates were contrived were 80,400 in June, and 88,100 in May, with single family starts accounting for 59,200 of June starts and 57,800 of units started in May. Most of the reported June decline in housing starts came from the a decline in the volatile starts in buildings with 5 or more units, in which fell from 29.400 units in May to just 20,400 units in June, so it's a fair guess that a slowdown in starts of apartment building accounted for most of the apparent pullback reflected in the headline numbers. Reported June home completions, which are also estimated at an annualized rate with a wide range of uncertainty (6.3% ±14.1%* higher than May) totaled 65,800, leaving a seasonally adjusted 624,000 homes under construction at the end of June, up from 621,000 at the end of May, suggesting it's doubtful construction employment will be affected by this one month contraction in housing starts.
This report also includes an estimate on new building permits issued during the month, and because they sample about half the permit issuing places in the US for this metric, the margin of error on new permits is small enough that we can get an real idea of the actual monthly activity. In June, new housing units authorized by permits were estimated to be at a seasonally adjusted annual rate of 911,000 (±1.0%), which was 7.5% below the May rate of 985,000 and 16.1% (±1.7%) above the estimate of 785,000 from last June. 624,000 (±1.2%) of those new permits were for single family units, statistically unchanged from May's 620,000 single family permits, and 261,000 units were authorized in apartment buildings of 5 or more units...
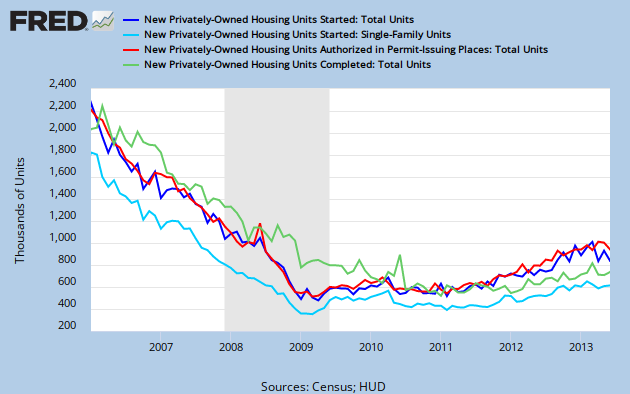
Above, our FRED graph for this report shows the census monthly estimate of total new home starts at an annual rate in dark blue going back to the beginning of 2006, while the portion of those that were estimated to be single family starts is shown in light blue. We can see that the seasonally adjusted starts are lower over the past three months than they were during the 1st quarter of the year, suggesting that unless starts pick up in coming months, new investment in residential structures may suffer in subsequent GDP comparisons, as it takes an average of 6 months for a single family home to be completed, and an average of 11 months from start to finish for all types of multi-unit building. Units of seasonally adjusted new housing construction authorized by permits is shown in red, and though they were at a post bubble high in April, we should have seen more of them turn into higher starts by now, as the average time from permit to start is less than a month for single family homes and less than two months for multi unit residential structures. This suggests that builders may be moving cautiously in the face of higher interest rates. Lastly, the green track on our FRED graph is total residential units completed per month, at an annualized rate. As long as the seasonally adjusted rate of starts remains above the rate of completions, construction employment should remain stable, if not increase, on a seasonally adjusted basis...
Comments
wide error margins
Although I think we've been victims of housing hype too. Interest rates are putting a damper but already housing is out of reach for the middle class and last I saw "institutional investors" were still a third of purchases on existing home sales.