
The key monthly release of the past week was on Personal Income and Outlays for May from the BEA, which gives us several important metrics, including PCE (personal consumption expenditures), which accounts for 70% of US economic activity, and the PCE price index, targeted by the Fed in recent rounds of quantitative easing. The BEA reported that personal income rose $69.4 billion, or 0.5%, from a seasonally adjusted annual rate of $13,695.0 billion in April to $13,764.4 billion in May; moreover, the reported 0.1% decline in income in April was revised to show a 0.1% increase... However, May's level is still below the annual income rate of $14,104.1 billion in December of last year, when incomes were boosted by accelerated bonus and special dividend payments and other manipulation of salaries to avoid the year end upper income tax hikes...May disposable personal income (DPI), or income after taxes, also increased by 0.5%, from a seasonally adjusted annual rate of $12,059.6 billion to $12,116.6 billion in May; which is also lower than the $12,539.1 billion DPI figure logged in December, before the payroll income tax cuts expired. Note that just like for GDP, BEA extrapolates the monthly figure into an annual rate, and that the actual monthly totals herein are roughly one-twelve of those reported; as BEA notes this in a footnote in its press release, this is often misreported...
Among sources of income gains in May was a $19.7 billion increase rate in wages and salaries, up from $6.5 billion last month; employer contributions to insurance and pensions increased at an annual rate of $3.4 billion, up from $2.5 billion in April. Business proprietor's incomes increased $5.4 billion and farmers saw their incomes fall at a $6.7 billion annual rate, the same they fell in April. Personal rental income decreased at a $0.7 rate billion in May, while interest and dividend income increased $31.2 billion; meanwhile, transfer payments from government programs increased by $19.4 billion, the largest of which was an $11.8 billion increase in social security benefits, reversing the $9.6 billion decline in April..
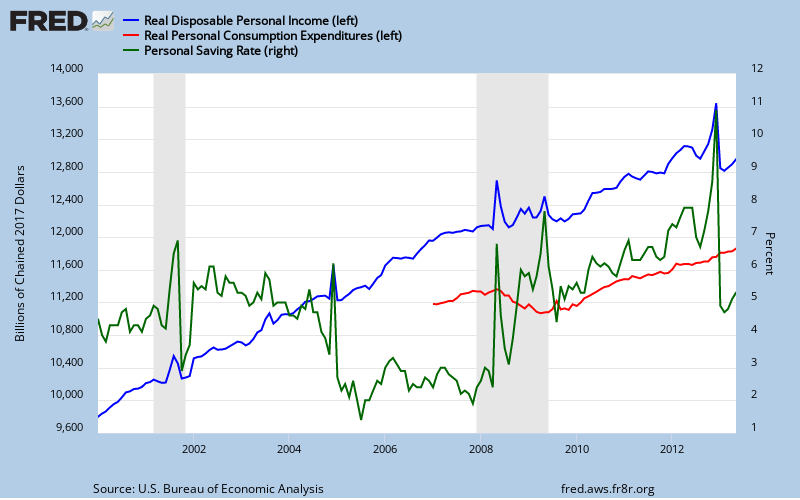
May data for personal consumption expenditures (PCE) showed a 0.3% monthly increase, from an adjusted annual rate of $11,351.0 billion in April to $11,380.0 billion in May, reversing the 0.3% spending decrease in April. Spending for durable goods rose $11.3 billion to $1,279.8 billion, spending for non-durables rose $7.3 billion to $2,573.7 billion and spending for services rose $10.5 billion to a $7,526.5 billion seasonally adjusted annual rate.. Total personal outlays, which includes interest and transfer payments in addition to PCE, rose $28.5 billion to a $12,116.6 billion annual rate. Personal savings, which is disposable personal income minus total outlays, was at $387.6 billion in May, the highest yet this year. The personal savings rate, which is savings as a percentage of disposable personal income, was at 3.2% in May, also the highest savings rate this year. You can see that uptick in the savings rate in green on our FRED graph below, with the scale for the saving rate on the right..
BEA also generates a price index for PCE with this report, which as we’ve noted, is the Fed's preferred inflation gauge. In contrast to a 0.3% decrease in that price index in April, it showed less than a 0.1% increase in prices paid for goods and services in May, as the index based on 2005=100 rose from 116.467 to 116.563; the core PCE price index, which excludes food and energy, was also up 1.0% for the month and now shows a year over year increase of 1.06%, barely higher than the all time low of 1.05% core PCE inflation set in April. The overall PCE price index shows a 1.02% inflation rate, which is up from the 0.73 year over year inflation shown in the April report...
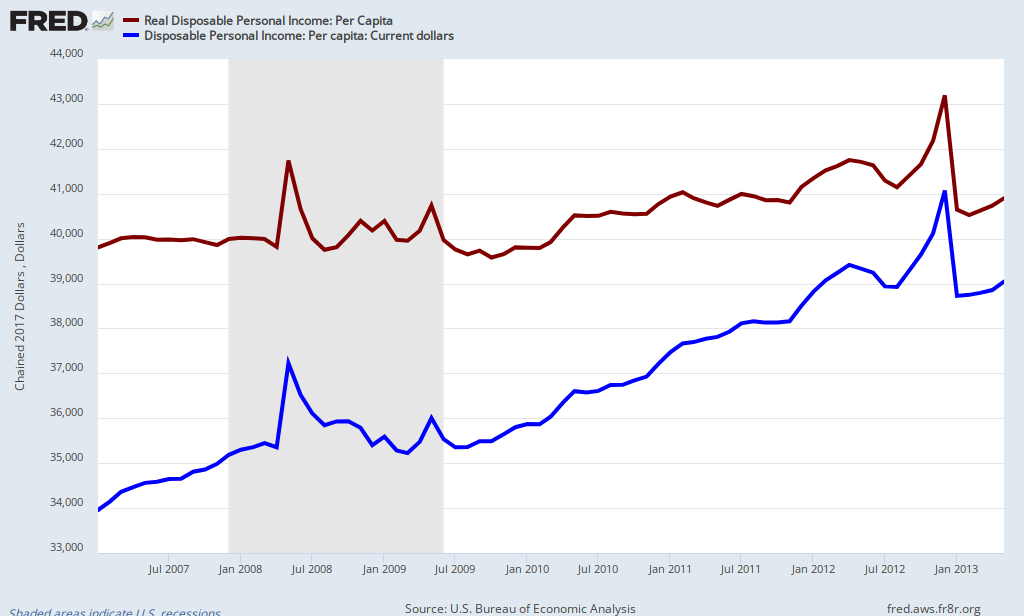
It is common practice to adjust both PCE and DPI for inflation using the PCE price index as a deflator. By that metric, real disposable personal income increased by 0.4% in May and 0.3% in April, while real personal consumption expenditures increased 0.2% in May after decreasing 0.1% in April; it is those inflation adjusted metrics that are charted on our FRED graph above; real disposable income in 2005 dollars is in blue, while monthly real spending in 2005 dollars is tracked in red, with the scale for both on the left of the graph (btw, the income spike you see in 2008 was the Bush tax rebate). On our FRED graph below, we have a close up of nominal disposable personal income per capita since 2007 in blue, which has now reached a level of $38,317 per person; on the same chart in brown we also have inflation adjusted disposable income per capita in chained 2005 dollars, which gives us a truer picture of how incomes have risen (or not) for the average individual since the recession. In the chained 2005 dollars used by the BEA, per capita income has barely budged since 2007 and is now at $32,875, up just 0.43% over a year earlier and just 14.8% since the turn of the century...
Comments
consumer spending GDP
So glad you covered this. I usually run a consumer spending calculation in the third monthly quarter but just eyeballing it, it looks weak, which implies yet another quarter of stagnant economic growth as well.