The Mortgage Monitor for August (pdf) from Black Knight Financial Services (BKFS, formerly LPS) reported that there were 695,548 home mortgages, or 1.37% of all mortgages outstanding, remaining in the foreclosure process at the end of August, which was down from 711,265, or 1.40% of all active loans that were in foreclosure at the end of July, and down from 1.80% of all mortgages that were in foreclosure in August of last year. These are homeowners who had a foreclosure notice served but whose homes had not yet been seized, and the August "foreclosure inventory" remains the lowest percentage of homes that were in the foreclosure process since late 2007. New foreclosure starts rose, however, from 75,404 in July to 80,500 in August, and while they were a bit lower than the 81,612 new foreclosures started in August of 2014, they've been volatile from month to month, and they have remained between 73,500 to 95,000 monthly since the beginning of 2014, which is still in a range about twice the monthly number of new foreclosures we saw in the precrisis year of 2005...
In addition to homes in foreclosure, BKFS data showed that 2,446,900 mortgages, or 4.83% of all mortgage loans, or were at least one mortgage payment overdue but not in foreclosure in August, up from 4.71% of homeowners with a mortgage who were more than 30 days behind in July and the highest delinquency rate since May, but still down 18.2% from the mortgage delinquency rate of 5.64% in August a year earlier. Of those who were delinquent in August, 865,435 home owners, or 1.71% of those with a mortgage, were considered seriously delinquent, meaning they were more than 90 days behind on mortgage payments, but still not in foreclosure at the end of the month. Combining these totals, we find a total of 6.20% of homeowners with a mortgage were either late in paying or in foreclosure at the end of August, and 3.08% of them were in serious trouble, ie, either "seriously delinquent" or already in foreclosure at month end.
As you should recall, the Mortgage Monitor (pdf) is a mostly graphics presentation from what was once the Analytics division of Lender Processing Services that covers a variety of mortgage related issues each month.. In addition to the summary data on delinquencies and foreclosures, this August monitor also includes graphics examining the potential impact of new guidelines from Fannie Mae and Freddie Mac that extended allowable foreclosure timelines and an analysis of refinance transactions vis a vis their prior loan counterparts in terms of interest rates, payment changes, term extensions, cash-out levels and servicer retention of refinance transactions over time. Some explanation of what those graphics reveal can be found in the BKFS press release that introduces the August Mortgage Monitor titled Black Knight’s August Mortgage Monitor: Cash-Out Refinances Up 68 Percent Year-Over-Year. However, since those topics are outside of our normal purview, we'll just include one graph below and that part of the Mortgage Monitor summary table showing the monthly count of active home mortgage loans and their delinquency status..
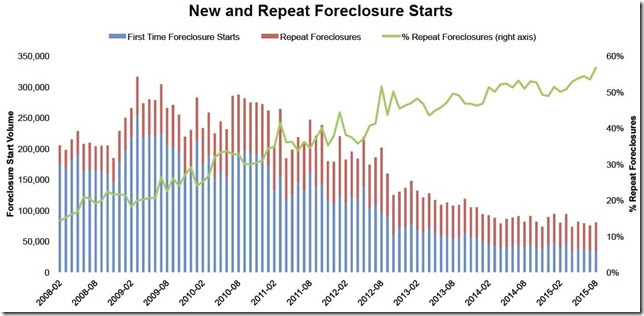
The graph that we'll include here, from page 5 of the mortgage monitor, shows the count of foreclosure starts as they occurred in each month since the beginning of 2008, wherein each bar represents monthly foreclosure starts, and within each bar foreclosure starts on mortgages that have never been in foreclosure previously are indicated in blue, and foreclosure starts on mortgages that had been in foreclosure at least once before are in red. The latter therefore represent mortgages that were in foreclosure, resolved that earlier foreclosure prior to a completed foreclosure sale either through a modification, or by making payments to get caught up on their loan, only to fall behind on payments again and end up in foreclosure yet another time. The green line on the graph then shows such repeat foreclosures as a percentage of total foreclosure starts for the month, which has now risen to a record 57% of all foreclosure starts, as a large number of those who've had their mortgages modified previously are now in foreclosure again. Such repeat foreclosures were up 13% in August and were the sole reason for the increase in foreclosure starts. Notice how the blue portion of the bars below continues to shrink; of the 80,500 foreclosure starts in August, only about 35,000 were first time foreclosures, which except for April, was the lowest level of first time foreclosures since the crisis began..
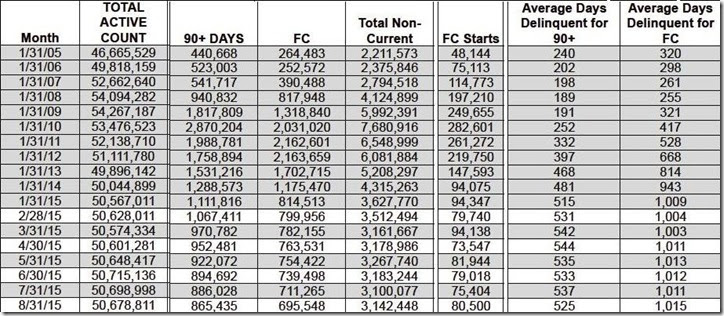
Last, in the table below from page 15 of the pdf, the columns show the total active mortgage loan count nationally for each month given, number of mortgages that were delinquent by more than 90 days but not yet in foreclosure, the monthly count of those mortgages that are in the foreclosure process (FC), the total non-current mortgages, including those that just missed one or two payments, and then the number of foreclosure starts for each month the past year and a half and for each January shown going back to January 2008. In the last two columns, we see the average length of time that those who have been more than 90 days delinquent have remained in their homes without foreclosure, and then the average number of days those in foreclosure have been stuck in that process because of the lengthy foreclosure pipelines. The average length of delinquency for those who have been more than 90 days delinquent without foreclosure, now at 525 days, is down from the April record of 544 days, while the average time for those who’ve been in foreclosure without a resolution is also off its record high of 1024 days reached in last October, but is still nearly three years at 1015 days
( NB: columns for 30 day and 60 day delinquencies were edited out of the above table to fit the page size; the full table can be viewed as a separate pdf here, or on an html webpage here )


1015 days
Good God, that's free rent, good to know! i do think America is still being squeezed as income, savings,wages just do not match expenses.
barbell shaped distribution of foreclosure inventory
the 1015 day average is deceiving...i figure a lot of them have been living rent free for 5 or 6 years, possibly because of compromised titles that make legal foreclosure difficult...look at that "average days delinquent for FC" column on the chart, see how the average went up by more than 100 days each of several years...that suggests that some old mortgages weren't being touched over that period...based on that, i'd guess the foreclosure inventory to include a large number of 5 year deliquent mortgages and a near equilvant number of newly delinquent mortgages to result in that average...
rjs