
The February 2017 New Residential Single Family Home Sales increased by 6.1%. Monthly sales increased by 34,000 annualized units to 592,000 for the month. Annual sales have increased 12.8%. Sales were 525,000 a year ago. In this Census survey, amounts are annualized and represent what the yearly volume would be if just that month's rate were applied to the entire year. These figures are also seasonally adjusted. New home sales also has a high monthly error margin and this month it was ±17.3%, with an annual error margin of ±18.0%. What this shows is the housing market is simply on fire. Prices are soaring and supply is short. We believe comparisons to the 2006 housing bubble are becoming appropriate.

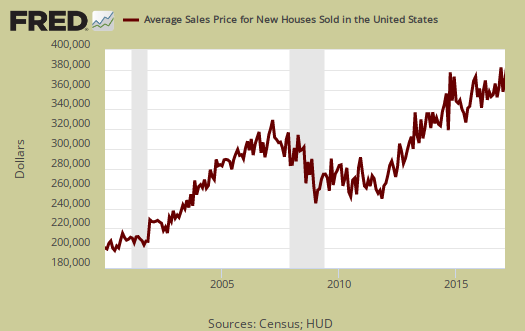
The February 2017 average home sale price is a very unaffordable $390,400. This is a whopping 9.9% monthly increase. From a year ago the average price has increased 11.7% and we can see from graphs housing prices are exceeding the 2006, 2007 bubble prices.
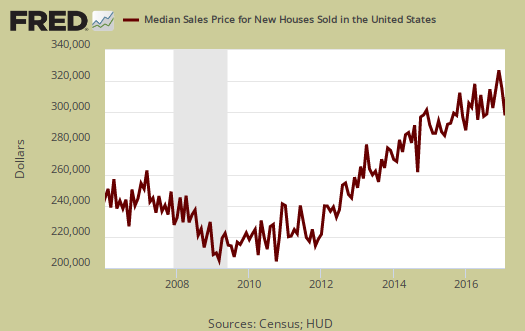
The median home price is $296,200, This is a decreased by -3.9% from the previous month. For the year, the median new home sales price has decreased by -4.9%. Median means half of new homes were sold below this price and both the average and median sales price for single family homes are not seasonally adjusted.
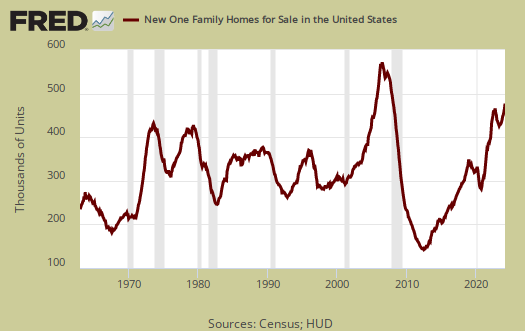
Inventories: New homes available for sale is now 266,000 units, a 1.5% increase from last month. From a year ago inventories have increased 9.9% and this is outside the ±5.8% margin of error. The monthly error margin is ±1.9%.
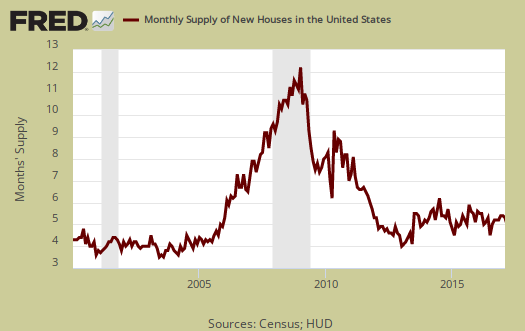
The graph below shows how long it would take to sell the new homes on the market at each month's sales rate. For February, the time stands at 5.4 months. This is a -3.6% drop from last month and a 1.8% annual increase, which shows a tight supply.
The median time a house was completed and on the market to the time it sold was 3.4 months. From a year ago that time period was 3.7 months. This also shows a hot housing market where properties are moving faster than a year ago.

February shows some real movement in the Midwest new homes market. Regionally sales in the West increased 7.5% while monthly sales in the Northeast declined by -21.4%, in the Midwest sales boomed by 30.9% and in the South increased slightly by 3.6%. Annually, sales in the West increased by 6.8%, the Northeast by 13.8% and the South by 7.9%, while the Midwest saw an astounding 50.8% annual sales increase. The impression is not that bubble areas like the West coast are completely out of reach the rest of the country is catching up to unaffordable housing nationwide.
The Census notes that the average revision is about 5% of the original reported. Here are our overviews of residential real estate statistics, only some graphs revised.
Recent comments