
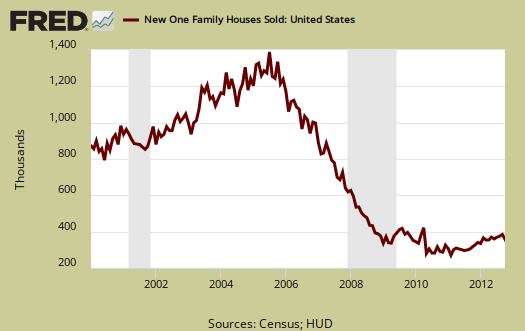
October New Residential Single Family Home Sales decreased -0.3%, or 368,000 annualized sales. July through September were all revised considerably lower. September was revised down from 389,000 to 369,000, which instead of the originally reported 5.7% increase gives a 0.8% change from August. August's single family new home sales were revised from 368 thousand to 366 thousand homes sold and July's annualized new home sales are now 366,000. Instead of that new home recovery so much touted new home sales are flat and less than May's 369,000 annualized sales. As we've repeatedly cautioned, beware of this report for most months the change in sales is inside the statistical margin of error and will be revised.
New single family home sales are now 17.2% above October 2011 levels, but this figure has a ±21.2% margin of error. A year ago new home sales were 314,000. Sales figures are annualized and represent what the yearly volume would be if just that month's rate were applied to the entire year. These figures are seasonally adjusted as well.
Case in point, the Northeast region was a -32.3% monthly decline in new home sales with an error margin of ±32.6%. The Midwest region saw a monthly new home sales surge of 62.2% yet this monthly percentage change has a ±80.5% margin of error, in other words, almost statistical noise. There are some blaming flat new home sales on Superstorm Sandy. The Census believes Sandy's impact was minimal and as we can see the flat sales were going on long before the storm hit on October 29th.
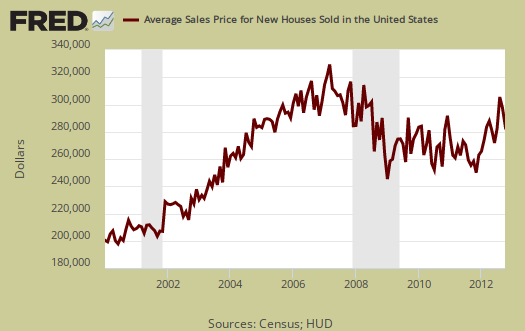
The average home sale price was $278,900, a -4.3% drop from last month's average price of $291,400. If one thinks about it, these prices are outside the affordability of most wages as it is.
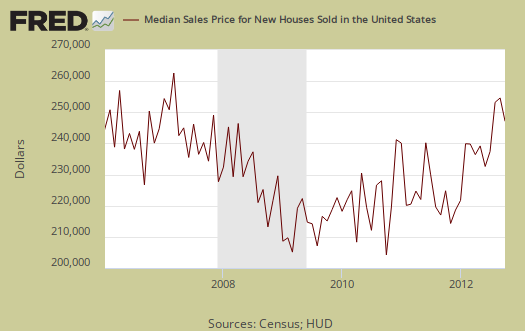
October's median price dropped -4.2%, from $248,000 to $237,700. Median means half of new homes were sold below this price and both the average and median sales price for single family homes is not seasonally adjusted.
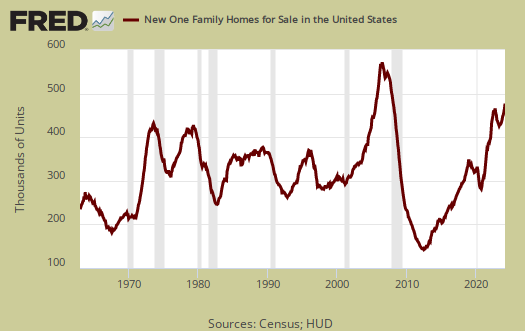
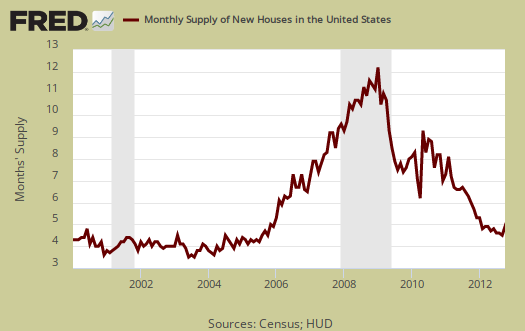
Inventories are still amazingly tight. The current supply of new homes on the market would now take 4.8 months to sell, a 2.1% increase from last month's 4.7 months to sell. The amount of new homes for sale was 147,000 units, annualized and seasonally adjusted. From a year ago housing inventory has declined -21.3% and is above the margin of error of ±16.4%.
Below is a graph of the months it would take to sell the new homes on the market at each month's sales rate. We can see these inventories vs. sales times have dropped dramatically from a year ago.
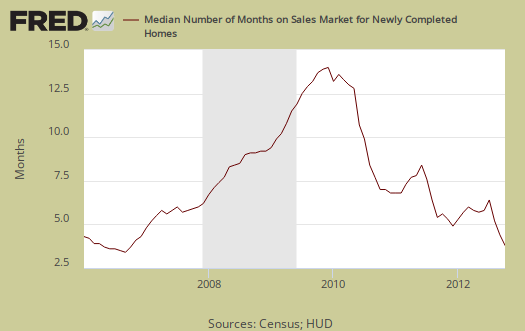
The median time a house was completed and on the market for sale to the time it sold was 5.9 months, a dramatic drop of 9.2% in comparison to September's 6.9 months.
The variance in monthly housing sales statistics is so large, in part, due to the actual volume declining, along with the fact this is a survey. One needs to look at least a quarter to get a real feel for new home sales, but a year of sales data is more in order. Additionally this report, due to it's huge margin of error, is almost always revised significantly the next month. Buyer beware on month to month comparisons and reacting to primarily figures and why we graph up the statistics so one can identify a real trend versus press headline buzz.
What we know about new homes sales are increasing from the year ago change. We also see new single family home prices being out of reach for most families by income. We list the margins of error for they are usually above the monthly reported percentage changes. The Census notes that the average revision is about 5% of the original reported.
Here is last month's new home sales overview, only graphs revised.
what is a sale?
in your discussion of sandy effects, it occurred to me that i dont know when a "sale" is recorded by census; is it the signing of a contract, or something else in the process?
the census FAQs didnt help much...
definition of "sale" for new home sales, Census
So, a sale is a fairly solid commitment. The Census is saying someone has put down the money without signing the agreement, or has signed the sales contract without the money down and sales can happen before even the permit to build the actual house has been processed.
So, the next question is what does the Census do with canceled contracts and sales?
From the website:
So, in bad times one would seemingly have high overestimates for a period of months that eventually will be dropped and the survey evens out.
Explains why even more this statistical release has such wide variance and error margins.
Thanks for asking this question. I share your frustration with the new Census site and they moved the FAQ to some ridiculous crappy aggregate thing. Please complain about it. They offshore outsourced the website design via IBM (who hires H-1B guest workers, fires Americans plus offshore outsources) and clearly it shows in such crappy design changes.
I personally find it disgusting that the Census, who probably has the most data to present of any government agency, would not hire regular Federal employees to deal with website design and instead would take taxpayer money and hand it to evil, crappy, offshore outsourcer IBM.
They should have all of this, in house, permanent, full-time Federal employees or U.S. citizen contractors only.
found it in the pdf footnote
a “sale” is defined as a deposit taken or sales agreement signed, this can occur prior to a
permit being issued. An estimate of these prior sales is included in the sales figure.
http://www.census.gov/construction/nrs/pdf/newressales.pdf
the fine print in gov. reports
Most government agencies will answer the phone for intelligent questions where the caller knows what they are talking about in the first place. But almost all of the time, the information is in the fine print somewhere.