
The September 2012 Residential construction report showed Housing starts increased 15.0%, and from a year ago have soared 34.8%. September's housing start annualized levels were 872 thousand, whereas August's housing starts tallied to 758,000. In August, housing starts increased by a revised 4.1%.
For the month, single family housing starts increased 11.0% and apartments, 5 units or more in one building structure, jumped by 25.0%. Since September 2011, single family housing starts have increased 42.9% whereas apartments have increased less, 18.7%.
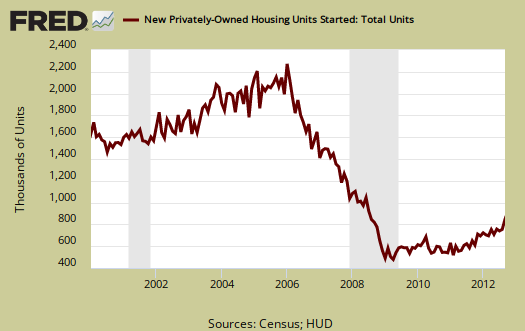
These figures are outside the margin of error and show a genuine improvement in new construction. Housing starts had a statistical error margin of ±12.1% for the month and ±18.2% from a year ago, although single family housing starts gains are inside the ±11.1% margin of error for the month as are apartments, ±38.9%. That said, single family new housing construction for the year is outside the ±14.7% margin of error. We mention the margin of error for almost always new residential construction are revised extensively and there is wide variance. This month's figures look solid to believe we do have significant new residential housing construction going on.
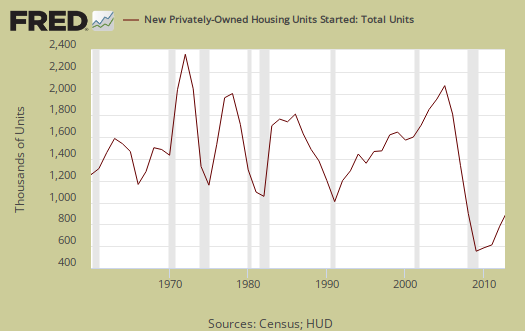
Housing starts are defined as when construction has broke ground, or started the excavation. One can see how badly the bubble burst on residential real estate in the below housing start graph going back all the way to 1960.
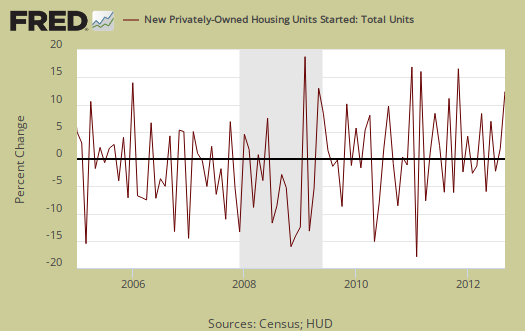
Below is a graph of the monthly change in housing starts so one can see the wild variance in change. This implies the wide error margins on the monthly statistics and why one should expect revisions and not put too much stock in the monthly percentage changes.
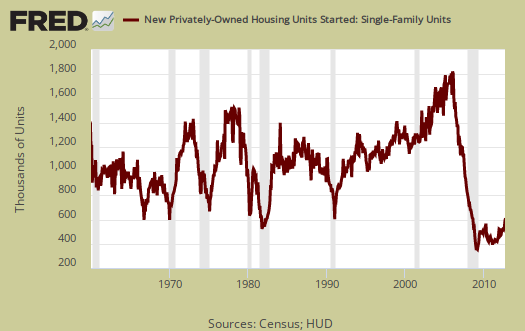
Single family housing is 75% of all residential housing starts. Below is the monthly graph of single family housing starts going back to 1960.
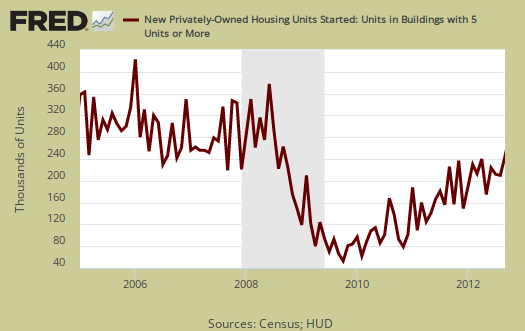
Below is the graph of new apartments started, called housing of 5 or more units.
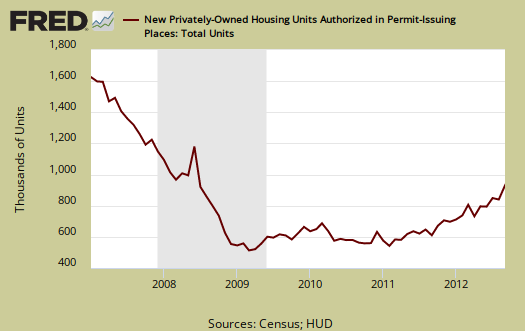
Building permits increased 11.6% to an 894,000 level and are up 45.1% from this time last year. The monthly change for building permits has a ±1.1% margin of error. In other words, building permits are much more accurate. Single family building permits increased 6.7% from last month. The below graph shows building permits are not always a smooth line from month to month. Building permits are local jurisdictions giving approval, or authority to build.
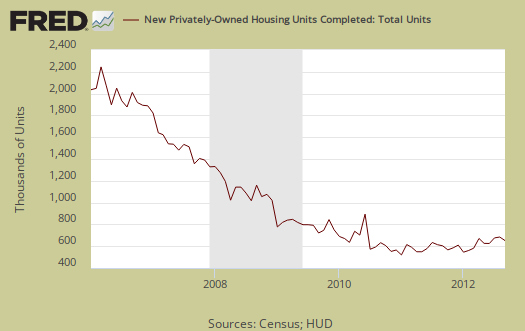
Housing Completions increased 0.4% and are now up 13.8%, from a year ago. Housing completions also have a large error margin, with a monthly error range of ±11.2%. Housing completions mean either people have moved in or the carpet is laid down. In other words the house is done, including the flooring.
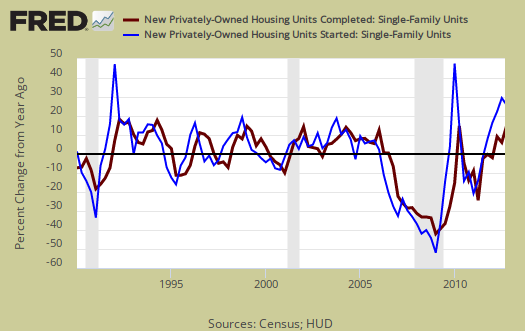
Single family housing completions lag housing starts by about 6 months, multi-family about twice that. Below are single family housing starts, three month average change from a year ago (blue), plotted against single family housing completions, quarterly average level change from a year ago (maroon). We can see some pattern of the lag between the two.
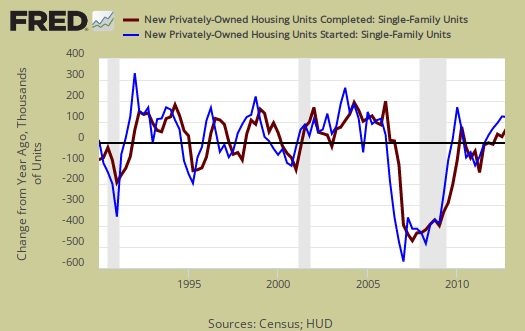
We'd also claim those who think housing is going to increase 50%, 100% for the rest of this year, aren't looking at the below, the quarterly percentage change, from a year ago in housing starts (blue) versus housing completions (maroon), single family. It looks more on track to see an overall increase of 7%-20% new single family homes constructed for 2012, which seems optimistic for middle class muddle land.
This report has a large variance, so to establish a trend line one must take into account really a year of data. This report is also seasonally adjusted and residential real estate is highly seasonal. The statistics are also annualized, which gives what the levels would be if one month's rates were the same for the entire year.
Bottom line is does appear housing is coming alive and this is a good news report.
no jobs follow thru
only 1100 more residential construction jobs in september, & the unadjusted totals YoY from the household survey show a loss of over 50,000 construction jobs