
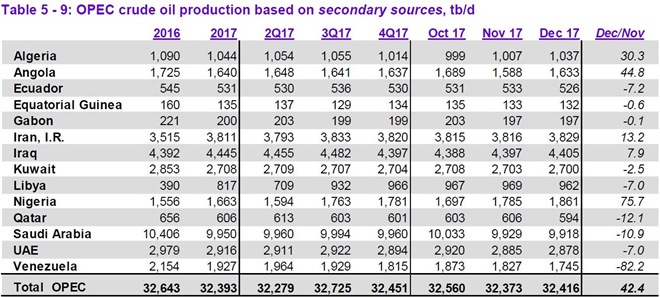
Since the media largely missed what the data from OPEC's February Oil Market Report (covering January OPEC & global oil data) actually showed, and since Saudi jawboning about oil supply and demand in advance of the Aramco IPO has been keyed to keeping oil prices higher, we'll take a quick look at that report, which is available as a free download. The first table from this report that we'll look at is from page 69 of that OPEC pdf, and it shows oil production in thousands of barrels per day for each of the current OPEC members over the recent years, quarters and months, as the column headings indicate. For all their official production measurements, OPEC uses an average of estimates from six "secondary sources", namely the International Energy Agency (IEA), the oil-pricing agencies Platts and Argus, the U.S. Energy Information Administration (EIA), the oil consultancy Cambridge Energy Research Associates (CERA) and the industry newsletter Petroleum Intelligence Weekly, as an impartial adjudicator as to whether their output quotas and production cuts are being met, to resolve any potential disputes that could arise if each member reported their own figures.
")
As we can see from this table of official oil production data, OPEC oil output slipped by 8,100 barrels per day in January to 32,302,000 barrels per day, from an December production total of 32,310,000 barrels per day, but that was a figure that was originally reported as 32,416,000 barrels per day, so their production for December was effectively a 114,000 barrel per day decrease from previously reported figures (for your reference, here is the table of the official December OPEC output figures as reported a month ago, before this month's revisions). As you can tell from the far right column above, the main reason that OPEC's January output fell by 8,100 barrels per day from revised December figures was the decrease of 47,300 barrels per day in output from Venezuela, which is suffering from the effects of economic sanctions imposed by the US. On the other hand, oil output from Iraq increased by 30,200 barrels per day, which leaves them and previously exempt Nigeria as the only OPEC members whose production is well in excess what their pact calls for, as can be seen in the table below:

The above table is from the "OPEC guide" page at S&P Global Platts: the first column of numbers shows average daily production in millions of barrels of oil per day for each of the OPEC members for January of this year, and the 2nd column shows the allocated daily production in millions of barrels of oil per day for each member, as was agreed to at their November 2016 meeting, and the 3rd column shows how much each country produced over or under their quota for the month. As of the November 2017 OPEC meeting, Libya and Nigeria, who were previously exempt from the quotas, were assigned a combined 2.80 million barrel per day cap, and Platts has indicated a cap of 1.00 million barrel per day for Libya and 1.80 million barrel per day for Nigeria in the table above. Note that Venezuela alone, now 330,000 barrels per day below quota, more than makes up for smaller amounts of over production by other OPEC members..
The next graphic we'll include shows us both OPEC and world oil production monthly on the same graph, over the period from February 2016 to January 2018, and it comes from page 70 of the February OPEC Monthly Oil Market Report. On this graph, the cerulean blue bars represent OPEC oil production in millions of barrels per day as shown on the left scale, while the purple graph represents global oil production in millions of barrels per day, with the metrics for global output shown on the right scale...

OPEC's preliminary data indicates that total global oil production rose to 97.66 million barrels per day in January, up by .35 million barrels per day from a December output total of 97.31 million barrels per day, which was revised down by .18 million barrels per day from the 97.49 million barrels per day global oil output for December that was reported a month ago. Global oil output for January was also 1.49 million barrels per day higher than the 95.82 million barrels of oil per day that was being produced globally in January a year ago (see last February's OPEC report online (pdf) for the year ago data). OPEC's January production of 32,302,000 barrels per day thus represented 33.1% of what was produced globally, down from 33.2% in December, as oil output increases by Canada, Mexico, Norway, UK, Bahrain, Brazil and Kazakhstan were partially offset by decreases in output from the US, Malaysia, Oman, Russia and Azerbaijan. OPEC's January 2017 production was at 32,139,000 barrels per day, which means that the 13 OPEC members who were part of OPEC last year, excluding their new member Equatorial Guinea, are now producing 29,000 more barrels per day of oil than they were producing a year ago, even with the collapse of Venezuelan production, with the increase largely due to recoveries of oil production in Libya and Nigeria.
The increase in global oil output that we can see in the above purple graph meant there was a surplus in the amount of oil being produced globally, as the next table from the OPEC report will show us..

The table above comes from page 41 of the February OPEC Monthly Oil Market Report, and it shows regional and total oil demand in millions of barrels per day for 2017 in the first column, and OPEC's estimate of oil demand by region and globally quarterly over 2018 over the rest of the table. On the "Total world" line of the second column, we've circled in blue the figure that's relevant for January, which is their revised estimate of global oil demand for the first quarter of 2018.
OPEC's estimate is that over the 1st quarter of this year, all oil consuming areas of the globe will using 97.23 million barrels of oil per day, which is an upward revision from their prior estimate of 97.17 million barrels of oil per day. Meanwhile, as OPEC showed us in the oil supply section of this report and the summary supply graph above, even after the OPEC and non-OPEC production cuts, the world's oil producers were producing 97.66 million barrels per day during January, which means that there was a surplus of around 430,000 barrels per day in global oil production vis-a vis demand during the month...
Global oil production estimates for December were also revised lower with this report, by 0.18 million barrels per day to 97.31 million barrels per day, while global demand figures for the 4th quarter were revised 0.09 million barrels per day higher at 98.29 million barrels per day. That now means there was a deficit of 980,000 barrels per day in December global oil output, which we had previously figured to be a global oil deficit of around 760,000 barrels per day. In addition, there was also a revision to oil demand estimates for 3rd quarter. On a cumulative basis for the entire year that worked out to be a 0.03 million barrels per day upward revision to 2017 oil demand (which we have circled in green). In round numbers, that means our previous estimate of a 183 million barrel oil shortfall for 2017 was about 10 million barrels too low. Hence, the revision to 2017 demand was almost enough to offset the 13.33 million barrels of surplus oil output that we saw globally in January.
note: the above was excerpted from my weekly synopsis at Focus on Fracking…
Recent comments