
The National Association of Realtors Pending Home Sales just jumped to the second highest level in a decade and the highest level in nearly a year. Pending home sales increased 5.5% in a month to an index level of 112.3. In May 2006, the index was 112.5 and from a year ago, the figure is up 2.6%. Last April saw a pending home sales index of 113.6.
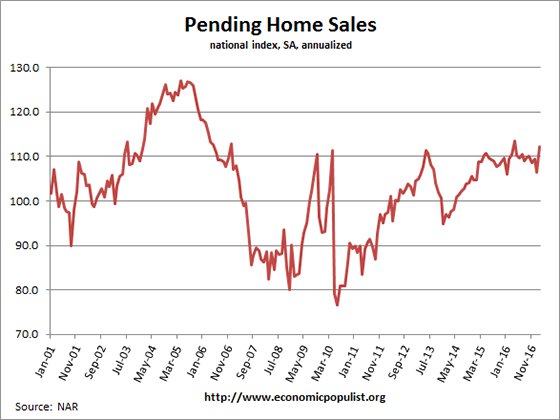
The above graph shows pending home sales have recovered to 2006 bubble year levels but not the years previous. The NAR believes the jump in pending home sales is simply pent up demand. They also believe the economy is good. Truth be told, not all got in the stock market. Also, the great economy for the middle class NAR assessment is questionable with such unaffordable housing forcing people into horrific debt. NAR also notes February was the warmest in decades. We don't know where they are living for the entire Northwest had record cold and rain.
Buyers came back in force last month as a modest, seasonal uptick in listings were enough to fuel an increase in contract signings throughout the country.
The stock market's continued rise and steady hiring in most markets is spurring significant interest in buying, as well as the expectation from some households that delaying their home search may mean paying higher interest rates later this year.
The PHSI are contracts which have not yet closed and why pending home sales are considered a future housing indicator. The PHSI represents future actual sales, about 45 to 60 days from signing. From the NAR:
NAR's Pending Home Sales Index (PHSI) is released during the first week of each month. It is designed to be a leading indicator of housing activity.
The index measures housing contract activity. It is based on signed real estate contracts for existing single-family homes, condos and co-ops. A signed contract is not counted as a sale until the transaction closes. Modeling for the PHSI looks at the monthly relationship between existing-home sale contracts and transaction closings over the last four years.
Below are the NAR regional pending home sales figures and they note February's increase was across regions.
The PHSI in the Northeast rose 3.4 percent to 102.1 in February, and is now 6.6 percent above a year ago. In the Midwest the index jumped 11.4 percent to 110.8 in February, but is still 0.6 percent lower than February 2016.
Pending home sales in the South climbed 4.3 percent to an index of 127.8 in February and are now 4.2 percent above last February. The index in the West increased 3.1 percent in February to 97.5, but is still 0.2 percent higher than a year ago.
NAR also notes how difficult finding and obtaining a property to even buy has become. Other reports show a very limited supply of new and existing homes.
The homes most buyers are in the market for are unfortunately the most difficult to find and ultimately buy, The country's healthy labor market is translating to greater job security, but affordability is not improving because home prices in some areas are still outpacing incomes by three times or more because of tight supply. How much new and existing inventory there is on the market this spring will determine if sales can reach their full potential and finally start reversing the nation's low homeownership rate.
Here are our past pending home sales overviews, unrevised.
Recent comments