
An important release from the BEA this week that completely slipped under the radar was the report on June Personal Income and Outlays, which tended to be ignored by the blogs and the media because it crossed the wires the same time Friday morning as the July unemployment report. But this report is arguably one of the more important of the regular monthly economic releases, as it not only gives us gross national figures on personal income and disposable income after taxes, but also gives us the monthly aggregate amount of personal consumption expenditures (PCE), which accounts for roughly 70% of the economy, total personal savings and the national savings rate, as well as the price index for PCE, which the Fed uses as it's inflation gauge when setting monetary policy...
Like the GDP report that Robert reviewed on Wednesday, earlier releases of this report underwent a major revision as of this report of data back to 1929 associated with the 14th comprehensive revision of the national income and product accounts Included were major definitional changes to personal income, including using an accrual approach for measuring defined benefit pension plans, which resulted in upward revisions to personal income receipts on assets for the entire period and upward revisions to income supplements for employer contributions for employee pension and insurance funds for most years. The estimates of proprietors’ income were also changed to more accurately account for capital gains and losses attributable to corporate partners. The cumulative effect of these and other changes on each of the categories of personal income over the past four years is shown in the chart below from the BEA and discussed in more detail in the latter half of the press release...

For June, seasonally adjusted personal income increased at an annual rate of $45.4 billion to an annualized $14,102.9 billion, 0.3% higher than May's annualized $14,057.5 billion; this was still $362.7 billion, or 2.5% below the gross income level of December of 2012, when special dividend payments, bonuses, and other fiscal cliff related tax avoidance schemes boosted incomes to an annualized $14,420.2 billion. June disposable personal income (DPI), which is income after taxes, rose at a $33.6 billion rate to $12,428.2 billion, also 0.3% higher than May, and also below the $12,829.2 billion annualized DPI of December...
Wages and salaries, which account for roughly half of income, did unusually well in June, rising at a $38.0 billion clip, with only government wages and salaries falling at a $0.5 billion rate; other sources of income in June included income receipts on assets (ie, interest and dividend income), which increased at a $22.7 billion rate, rental income, which was $1.5 billion higher, and business proprietors income, which rose at a $2.3 billion clip. In addition, transfer payments were $6.0 billion higher at an annual rate, led by a $4.2 billion increase in social security payments. Meanwhile, contributions to government social insurance, which subtract from income, rose at a $4.9 billion rate, and farm owner's incomes fell at a $24.0 billion annual rate.
Spending increases outpaced incomes in June, as personal consumption expenditures (PCE) rose $59.4 billion, or 0.5%, to an annualized $11,476.3. Spending for durable goods rose $10.7 billion to $1,267.8 billion, while spending for non durables rose $33.5 billion to $2,619.4 billion and spending for services rose $15.2 billion to $7,589.1 billion, all at a seasonally adjusted annualized rate..
Total personal outlays, which includes personal interest payments and personal transfer payments in addition to PCE, increased $55.3 billion to an annualized $11,881.5 billion in June. Personal savings, which is disposable personal income minus total outlays, was thus at $546.6 billion in June, down a bit from the $568.3 billion of savings in May. This left the personal saving rate, which is savings as a percentage of disposable personal income, at 4.4% in June, compared with the 4.6% year to date high savings rate in May. This and the track of other major metrics from this report can be seen on our FRED graph below, which shows the personal savings rate in green, real disposable personal income in blue, and real PCE in red since January 2000.
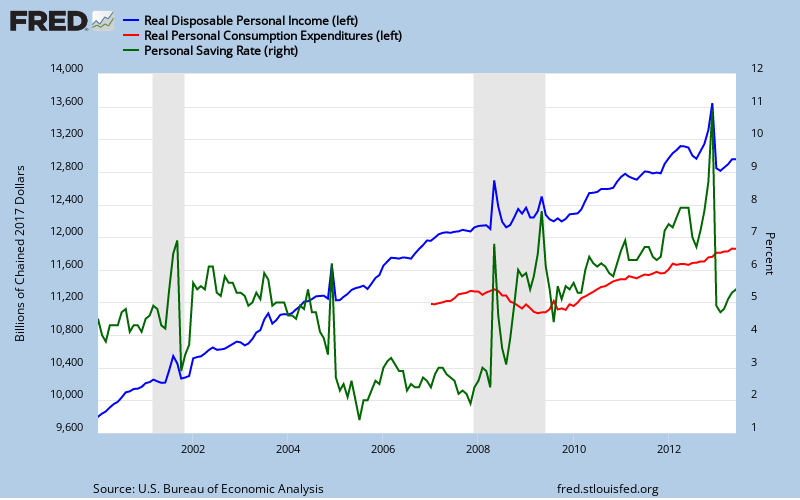
The metrics for real disposable personal income (DPI) and real personal consumption expenditures (PCE) shown above are arrived at by adjusting DPI and PCE for inflation using the PCE price index, which is also generated with this report, and which we've noted, is the Fed's preferred inflation gauge. The price index for PCE increased 0.4% in June, in contrast to an increase of 0.1% in May and a negative 0.3% in April. The result of applying this deflator was to change real disposable personal income into a 0.1% decline, and to reduce real personal consumption expenditures to a 0.1% increase. The June core PCE price index, which excludes food and energy, was up 0.2 percent, up from 0.1% in May. The year over year rate on the headline PCE price index has now risen from last month's 1.07% to 1.31%, while the year over year Core PCE price index is unchanged at 1.22%, both well below the Fed's target of 2.5%...
Comments
glad you got to this
I have this overview half done, but now I'll skip it. What bothers me and I'd have to calculate it all out, is how PCE, chained 2009 dollars, only increased 0.1% for Q2, yet still managed to contribute most of Q2 GDP.
That doesn't jive intuitively, except for maybe the new price indexes?
the adjustment still doesnt make sense...
the seasonally adjusted annual rate of consumer spending for non-durable goods actually dropped at a 2.1% rate from $2,607.0 billion in the 1st quarter in already seasonally adjusted current dollars to $2,593.2 billion in second quarter, but the adjustment of that from nominal dollars to chained 2009 dollars resulted in a 2.0% annualized rate of increase, from $2,322.2 billion to $2,333.7 billion, as you noted in the GDP thread...
i still cant see that a 4.1% swing like that could be correct..
rjs