
The October state employment statistics shows the unemployment rate has evened out and become more similar across states. The national unemployment rate was 5.8% and 22 states show similar unemployment rates, 12 plus the D.C. area were above the national average and 16 were below. For the month, 34 states plus the District of Columbia saw their unemployment rate go down while 5 states experienced an increase. Below is the BLS map of state's unemployment rates for the month and they do not change the scale to show how nationwide the United States is supposedly out of the red when it comes to unemployment. The fact the entire map is now shades of beige shows how nationwide unemployment has improved
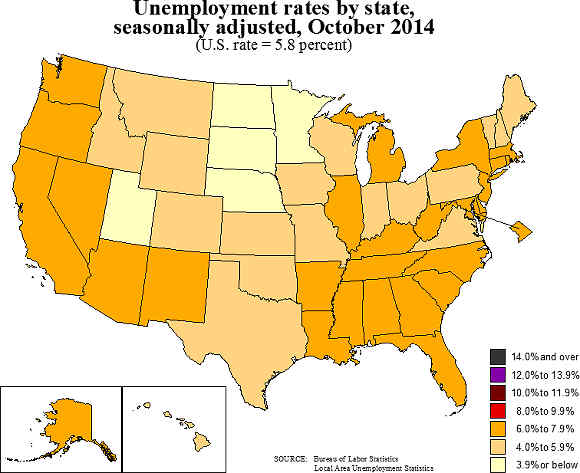
There are eight states plus the District of Columbia with unemployment rates above 7%. In order they are Georgia 7.7%, Mississippi 7.6%, D.C. 7.6%, Rhode Island 7.4%, California 7.3%, Nevada 7.1%, Tennessee 7.1%, Michigan 7.1% and Oregon 7.0%. There are now many states with very healthy unemployment rates. North Dakota leads with 2.8% and South Dakota touts a 3.3% unemployment rate. Hawaii is 4.1% and even Colorado is 4.3%. It's fairly clear some states have finally recovered from the great recession jobs slaughter in 2014.
The unemployment change from a year ago nationally has declined by -1.4 percentage points. The biggest improvement has been in Illinois with a -2.5 percentage point improvement . Nevada's rate has also improved for the year, with a -2.3 percentage point change from October 2013. Colorado's rate declined 2.2 percentage points and Ohio's unemployment rate declined by -2.1 percentage points over the past year. All in all, 42 states plus D.C. showed an unemployment rate decline since October 2013. The decrease in unemployment rates isn't that news by itself since the rates can be declining due to lower labor participation rates.
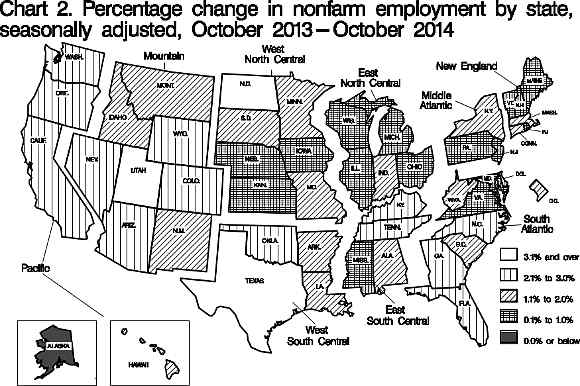
State monthly payrolls for October increased in 38 states, decreased in 12 plus the District of Columbia. By percentages of total payrolls, Wyoming showed a 1.4% increase in jobs, with Idaho increasing 0.8% and Utah 0.7%. Both Montana and Nevada showed a monthly -0.6% employment decline and poor Rhode Island dropped -0.5 percent in payrolls.
For the year, everyone gained jobs except for Alaska, whose payrolls dropped by -0.2%. North Dakota had a whopping 5.0% annual payrolls gain with Utah gaining +3.8% and Texas showed a +3.7% employment increase. The below map shows the past year ago change for payroll growth.
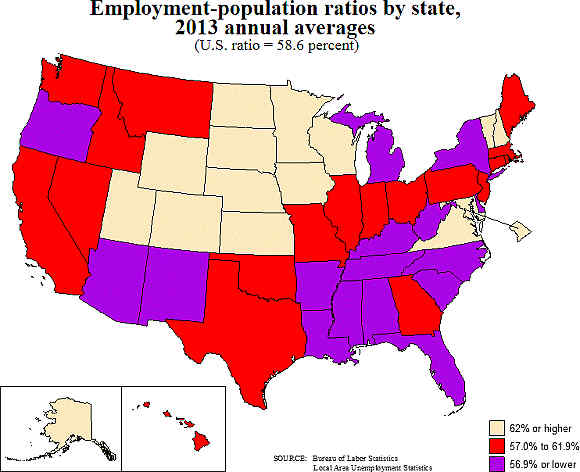
While the unemployment rates have improved, one needs to also look at the labor participation rate. Below is the BLS map for the annual 2013 population to employment ratios and October's rates are here. One can see except really low ratios in states with more normal unemployment rates and the states with higher unemployment rates have on average lower participation rates. When one sees a low population to employment ratio along with a high unemployment rate, most likely this implies people are not being counted as unemployed.
Generally speakingthe above maps paint a much improved state employment picture, although there are obviously millions of people who aren't being counted in some states because they stopped looking for work. Still in comparison to 2013 state employment is finally moving and improving. All above maps were created by the BLS.
Recent comments