
The January State and Regional Unemployment statistics were released today:
Thirty states and the District of Columbia recorded over-the-month unemployment rate increases, 9 states registered rate decreases, and 11 states had no rate change
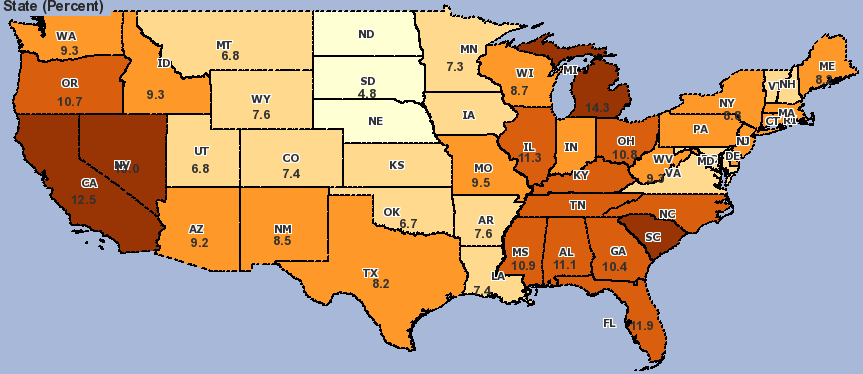 Click on Map to Enlarge
Here is the monthly percent change map. Remember, this data is from January 2010, it's now March.
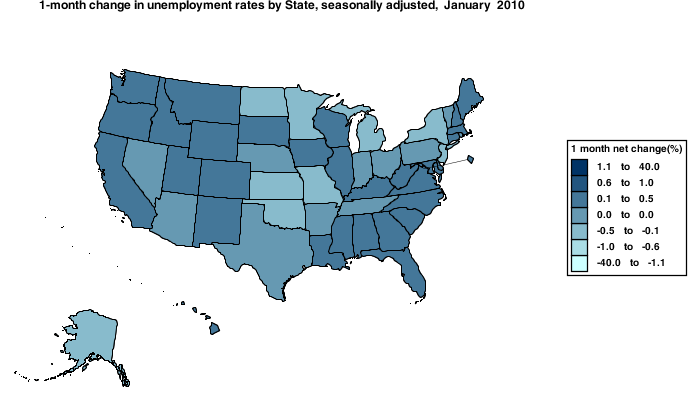 Click Map to Enlarge
Here is another state unemployment rate map:
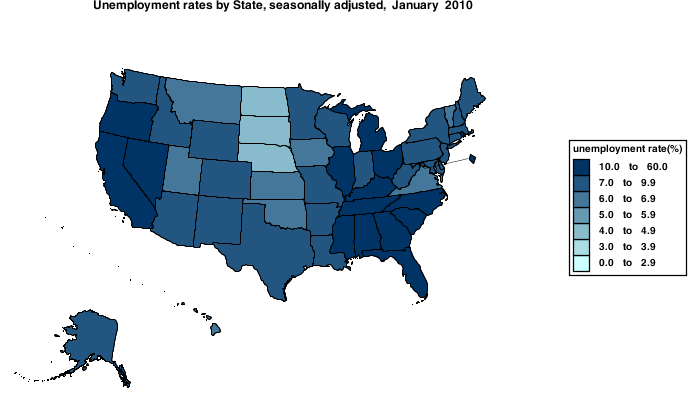 Click Map to Enlarge
Poor District of Columbia, always an asterisk in the statistics. The above reflects the increasing long term unemployed. That said, there is also a silver lining of good news, the actually number of jobs did increase:
In January, nonfarm payroll employment increased in 31 states and the District of Columbia, decreased in 18 states, and remained unchanged in 1 state. The largest over-the-month increase in employment occurred in California (+32,500), followed by Illinois (+26,000), New York (+25,500), Washington (+18,900), and Minnesota (+15,600). The District of Columbia experienced the largest over-the-month percentage increase in employment (+1.0 percent), followed by Alaska (+0.9 percent), Washington (+0.7 percent), Minnesota and Utah (+0.6 percent each), and Illinois (+0.5 percent). The largest over-the-month decreases in employment occurred in Missouri and Ohio (-12,800 each), followed by Kentucky (-11,800), New Jersey (-9,100), Florida (-6,100), and Nevada (-5,700). Kentucky (-0.7 percent) experienced the largest over-the-month percentage decrease in employment, followed by Missouri and Nevada (-0.5 percent each), and Alabama, Kansas, Mississippi, and Ohio (-0.3 percent each). Over the year, nonfarm employment decreased in 48 states and increased in 2 states and the District of Columbia. The largest over-the-year percentage decreases occurred in Nevada (-6.9 percent), Arizona (-5.4 percent), Wyoming (-5.0 percent), and California (-4.8 percent).
The report (which is uploaded here since these reports not easily located after the next release), also has a host of tables and more maps.
Subject Meta:
Forum Categories:
| Attachment | Size |
|---|---|
| 444.44 KB |
Recent comments