
So much has been made of the subprime mortgage meltdown that you would think it was almost totally responsible for the economic collapse, and that once the subprime problem was fixed then the worst would be over.
Unfortunately nothing could be further from the truth, despite hitting new highs in foreclosure listing. Instead it was the first round of a three part collapse, and we are on the edge of the second round.
I will demonstrate with a fantastic series of charts below, most of them were created by the T2 Partners.
Round One
First, let's take a look at the subprime and overall housing market.
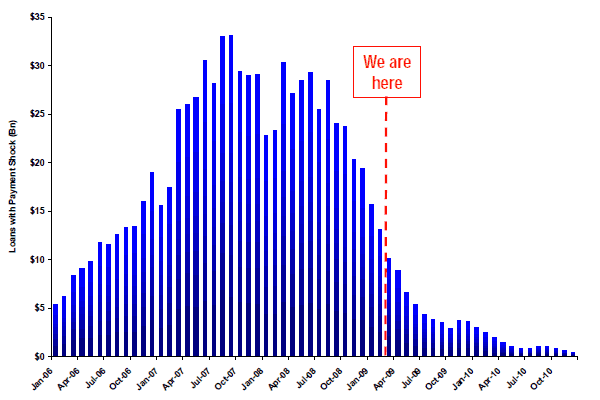
As you can see, the huge wave of subprime mortgages resettings from "teaser" rates to market rates has virtually ended.
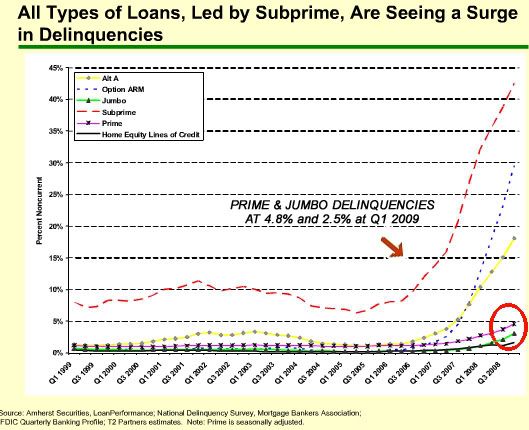
In its wake we've seen a massive spike in subprime mortgages going into default and foreclosure.
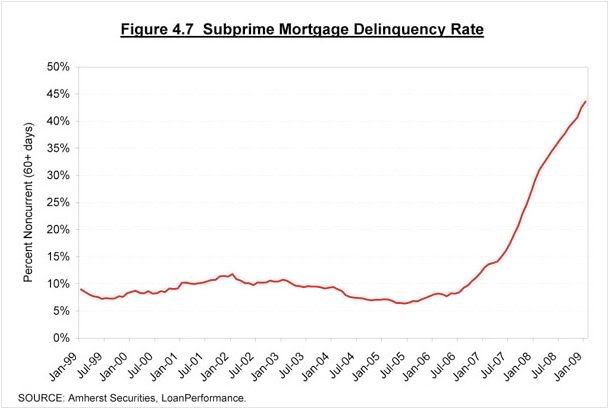
The damage inflicted has been severe.
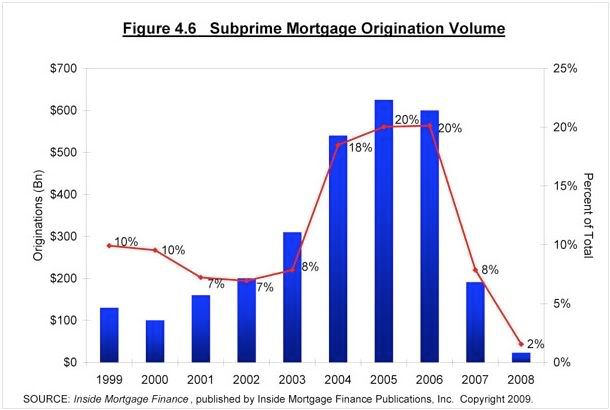
The problem is that subprime mortgages were never a significant part of the mortgage industry.
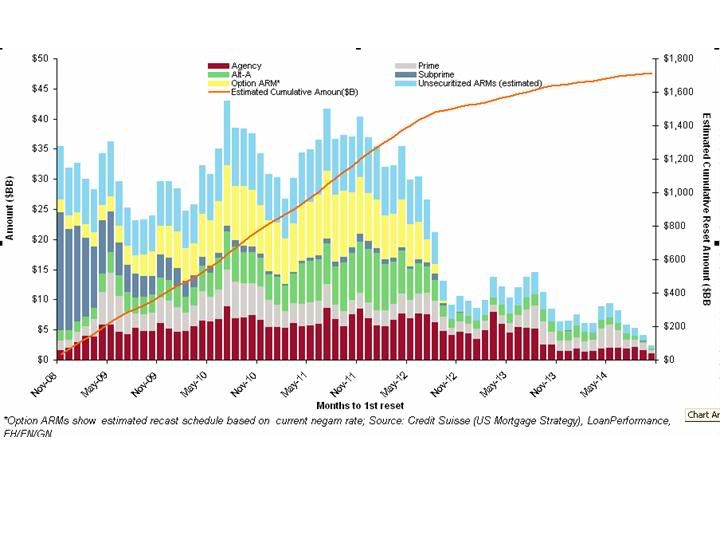
The resetting of "teaser" rate mortgages into market rate mortgages has only just begun.
(click image to enlarge)
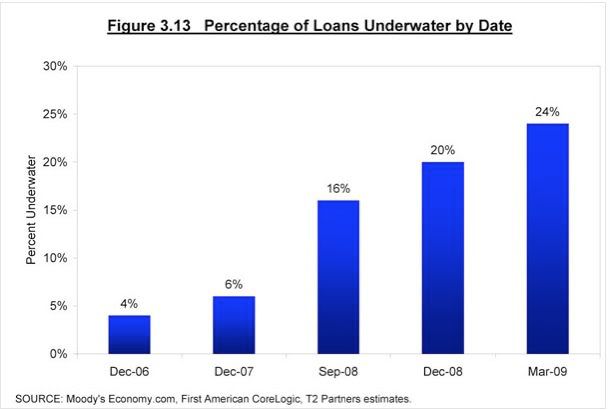
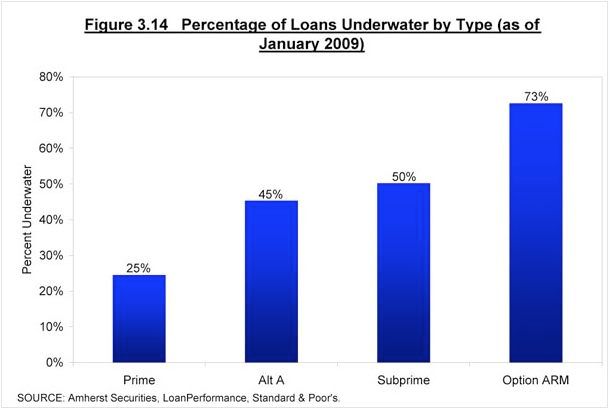
The problem of negative equity has already leaked out into other mortgage classes even before the teaser rates have expired. The percentage of homes going into negative equity has increased by 50% in just 6 months.
The Boston Federal Reserve has documented that negative equity is the leading cause of foreclosures.
As you can see, subprime isn't the mortgage class in the most danger - Option-ARM is.
Round Two
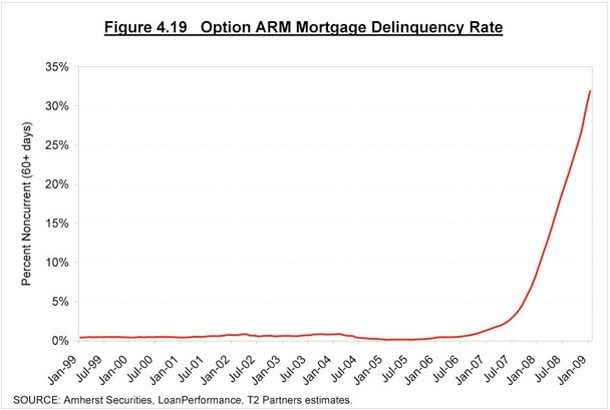
Most subprime mortgages had teaser rates lasting 2 or 3 years. Alt-A and Option-ARM mortgages usually had teaser rates of 5 to 7 years.
That's why you saw the subprime market implode first.
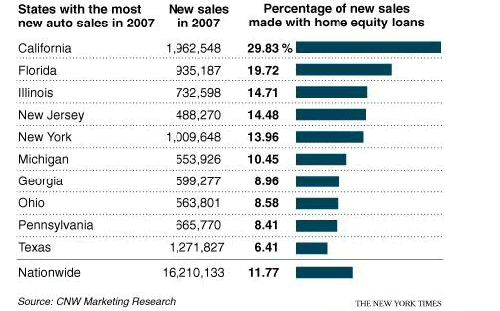
However, most Option-ARM mortgages had "triggers" in their contracts so that they would automatically amortize once they've reached a certain level of negative equity, usually around 110%. (see this link for a detailed explanation)
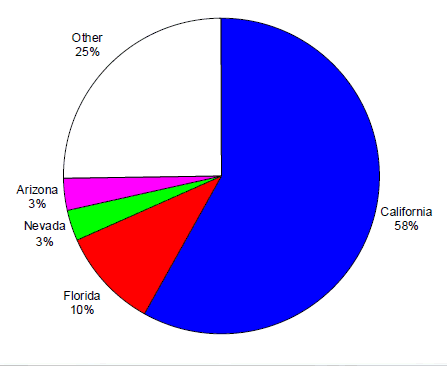
The Option-ARM market was overwhelmingly concentrated in the state of California.
Round Three
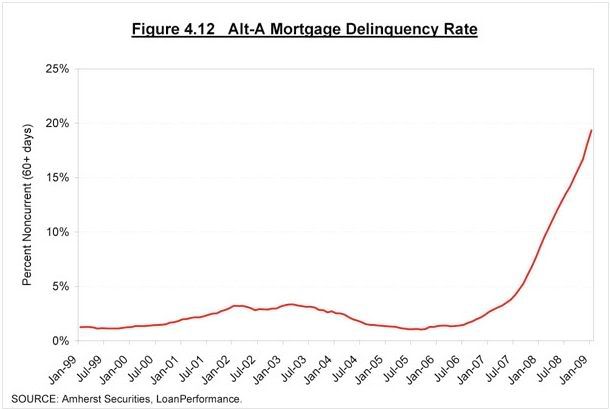
The Alt-A market is the other ticking timebomb about to explode.
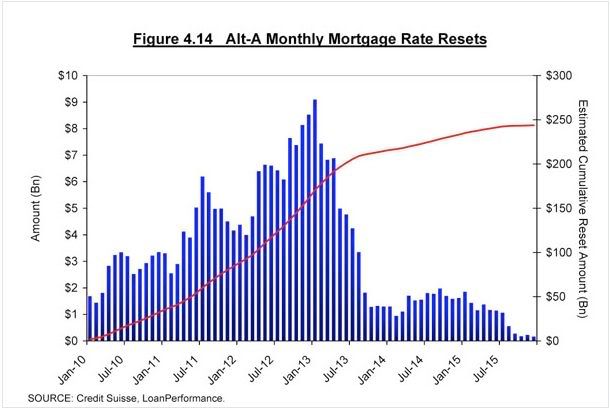
Years before the resetting of Alt-A mortgages has peaked defaults are already skyrocketing. If this trend continues it would easily be the worst mortgage class of them all.
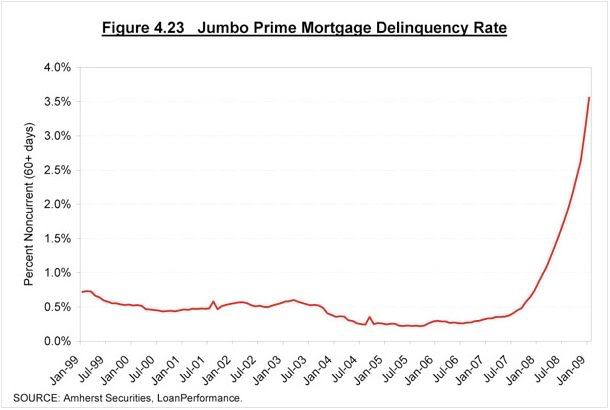
Finally, we need to mention one of the safer of the mortgage classes - jumbo.
Putting this into perspective
The housing market is so large that it effects all other asset classes. It's meltdown comes at a terrible price.
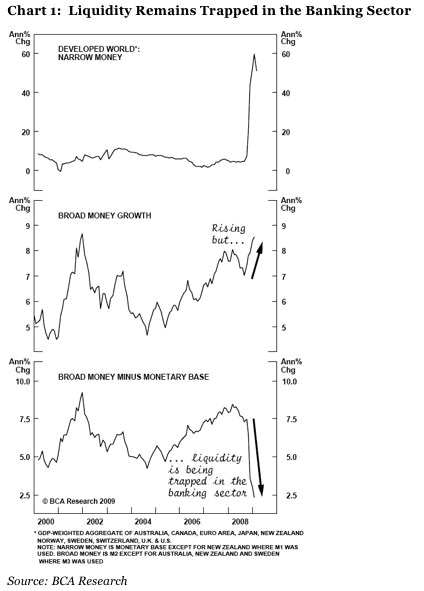
It's effect on the banking industry can be seen in the monetary base and credit markets.
If you judge where the housing market will bottom by historical averages, then we still have a ways to go.
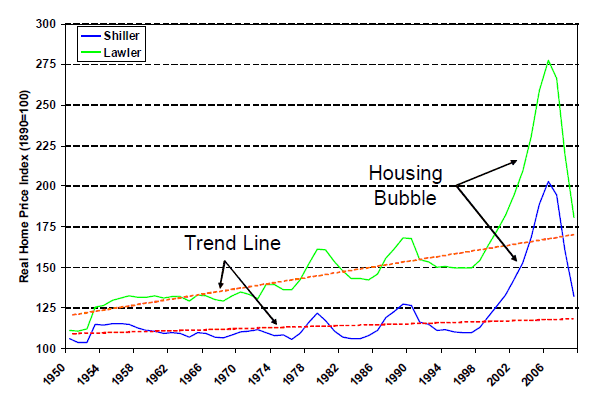
Notice how historically housing recessions have overshot to the downside of the trend. Since no housing bubble has ever reached the insane levels of the recent one, you can expect the overshoot to be particularly deep.
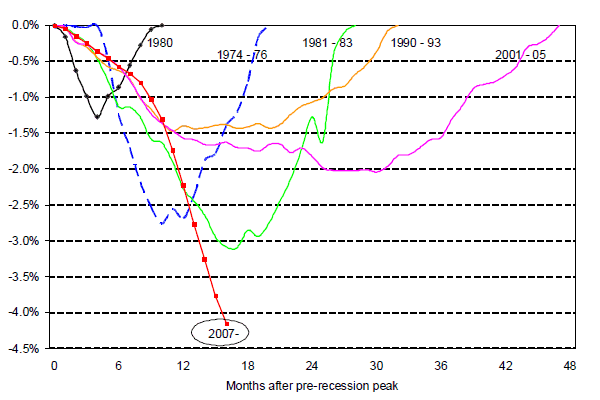
Making the depth of the housing recession look increasingly scary is the depths of the jobs recession we are still sinking into.
To put this economic crisis into perspective, check out the other asset classes in the economy, and their expected losses.
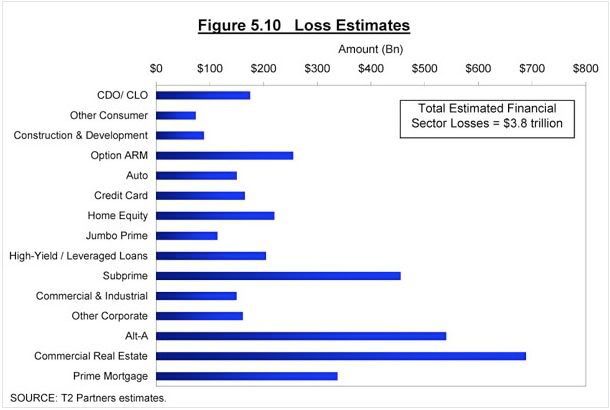
Notice the expected losses in commercial real estate. These loans were typically written to reset after 5 to 7 years. The writedowns in these loans are just about to strike.
Comments
We still have a solvency problem.
And, was the liquidity dump a waste of money? Very little new lending, toxic assets and liabilities are still on the books. Nothing has changed for the financial conglomerates except accounting rules.
RebelCapitalist.com - Financial Information for the Rest of Us.
Why did Fed and Treasury use $12 trillion?
So that financial conglomerates can horde all that money:
Loans by banks taking U.S. aid fall by $42 billion
Give us are damn money back! Part of that $12 trillion could have been used to lend directly to people and small businesses.
RebelCapitalist.com - Financial Information for the Rest of Us.
disaster in pictures
I haven't been tracking on the latest, but what is the percentage of these option ARMS that can refinance and
1. can they now refinance at a lower home evaluation?
2. can they afford to refinance, qualify?
The new Helping Families Save Their Homes Act , I'm not sure what are the projections (if any) with this new tsunami coming at us.
This is a great post midtowng. Me likey pictures, me likey charts and graphs. Really spells out the case.
Mindset readers welcome to EP!
Your great disaster in pictures was picked up on by Jim Sinclair's site, who appears to be a commodities/currency investor expert.
jsmineset
Hi Robert,
I'm a jsmineset reader and I also read financialsense.com, Peter Shiff's site and The Market Ticker by Karl Denninger. This blog was suitably scary. I live in Australia and we watch what is going on in the USA with fascination and horror - horror because we are starting to see the cracks appearing in our own economy.
Have you checked out Martin Armstrong's work on Scribd.com?
regards,
Sherry
welcome to "scary" EP!
Yeah, btw, can I immigrate? ;)
No, I'm not familiar with Armstrong, but on EP, you can link and quote in comments by creating a user account on the upper left. All sorts of features are enabled, like fully featured HTML writing and the site is a community site.
Maybe you can link up and quote some of his better work for us?
One Wrinkle
Armstrong is currently in prison and is banned from using computers. He does his work with a typewriter, pencil, and paper and then sends it out by mail to someone. They scan it, probably with a digital copy machine, to make a pdf file which ends up on scribd. The file is not OCR-ed, just a picture of a piece of paper.
Anyone who wants to quote it will have to type by hand. Maybe you can go to scribd, search on Martin Armstrong, read it, and type up anything you think is interesting.
Subprime meltdown over; now comes the bad news
An excellent compilation and presentation of data on this subject, along with the analysis of the consequences of your data.
I'm puzzled, though, with respect to one graph - on the "real home price index". Nominally, my understanding is that U.S. home prices roughly tripled between 1997 and 2006. And in nominal terms, home prices are not even at the half-way point to that starting point - the most-optimistic projection of a "bottom".
Yet when I look at your "real" price index, the price indices you chart there have suffered 2/3 to 3/4 of their expected declines.
Can you help me out with my confusion? Am I wrong about nominal prices, or is it possible that your data is off - based on the fictionalized, inflation data that the government churns out?
Thanks.
Jeff
Outstanding graphs, but ??
Outstanding column with graphs, but the last one, Figure 5.10, Loss Estimates; I thought that CLOs make up a portion of the commercial real estate market (along with the private equity loans)? Are those entirely separate?
Not that it really matters all that much in the scheme of things. So the Soviets lost $$$ big time in their war in Afghanistan, which, according to Brzezinski's memoirs, he engineered. Now the US is losing $$$ big time in their war in Afghanistan, destroying wedding party after wedding party, unfortunately. And Brzezinski signs the Bretton Woods Committee letter in furthering the offshoring of American jobs.
Anybody for a public roasting of Brzezinski (as in burning at the stake)?
Cassandras saw this coming
and events have shown that theirs were not worst case scenarios. Good post.
But a question: what's an unsecuritized ARM? Not what it sounds like, I hope.
Keep an eye on the 1 year
Keep an eye on the 1 year LIBOR. Most of these ARMS adjust to some percent above LIBOR, which is very low right now.
Look at Eurodollars futures
Which are really bonds based off of LIBOR, nothing fancy, you are seeing what you mentioned already. Front months are sliding, but nothing like what you're seeing far down the road. You are really seeing backwardization going on in the futures for LIBOR and other debt instruments. Now normally, you would see a positive yield curve on longer term instruments, you'd expect a 10-year to have a higher rate than a 2-year. That isn't what catching attention, but the velocity of the fall, not to mention the spreads widening between say a December 09er versus a Dec 10. To give you an idea, GEZ9 dropped .0800, while GEZ0 dropped .2000!
I have included below a chart between the two contracts. Note the spread.
-------------------------------------------- www.venomopolis.com
This has been expected since
This has been expected since last September in terms of creep to quality. The problem is...jobs. Even the remaining employed engineers are iffy right now. Hard to make payments without steady earnings.
Ouch
There are sure a lot of straight lines in those graphs, sudden drastic changes in the housing market sure aren't a good thing. No wonder the housing market is in such a mess. Thanks for sharing.