
The Consumer Price Index increased 0.2% for March, the same rate as February, as overall energy costs continued to rise. Gasoline prices alone increased 3.9%. Inflation without food or energy prices considered increased 0.2% for the month. From a year ago overall inflation declined -0.1% and this is due to the previous plunge in gasoline prices. CPI measures inflation, or price increases.
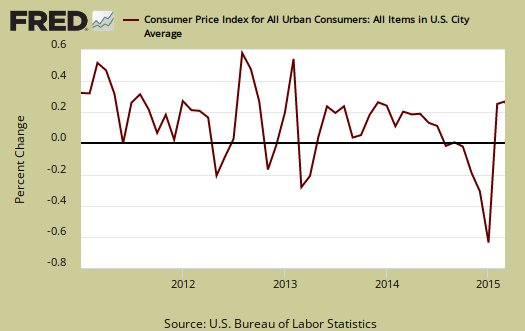
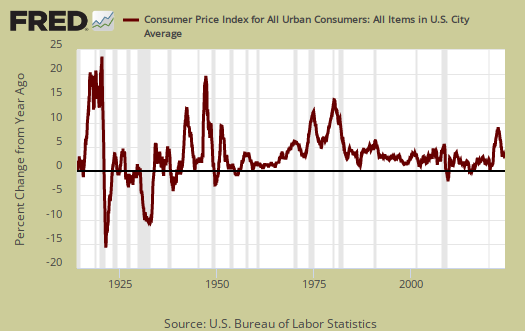
Yearly inflation is now flat as shown in the below graph as gasoline prices really gave a break to consumers.
Core inflation, or CPI with all food and energy items removed from the index, has increased 1.8% for the last year. Core CPI is one of the Federal Reserve inflation watch numbers and 2.0% per year is their target rate. While all are predicting interest rates will rise, Federal Reserve Chair Janet Yellen has testified that the low inflation numbers are a a concern since increased interest rates would lower economic activity. Most in the press screamed this month means the Fed will raise interest rates, yet one can see from annual inflation it's really tame, so expect any Fed increase to be very small. Graphed below is the core inflation change from a year ago.

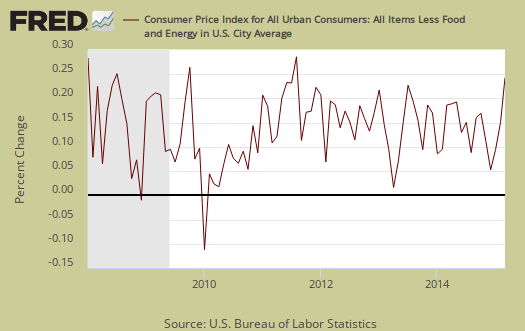
Core CPI's monthly percentage change is graphed below. This month core inflation increased 0.2%, mainly on shelter.
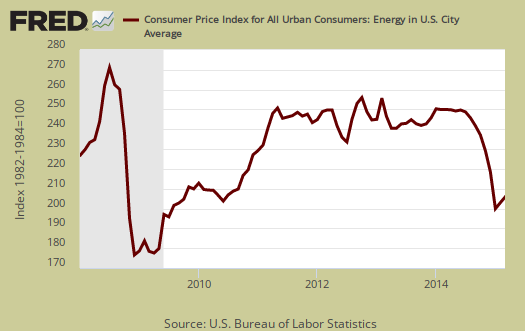
The energy index overall increased 1.1% for the month, but is still down -18.3% from a year ago. The BLS separates out all energy costs and puts them together into one index. Gasoline by itself increased 3.9% for the month while fuel oil jumped 5.9%. For the year, gasoline has declined -29.2%, while Fuel oil has dropped -24.9%. Natural gas dropped for the month by -2.7% while Electricity dropped -1.1%. From a year ago national gas prices have declined -14.4% and electricity is about break even, a 0.9% increase. Graphed below is the overall CPI energy index.
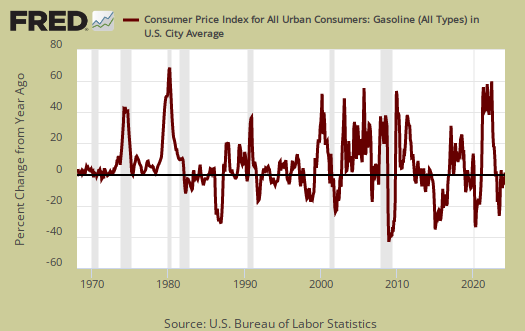
Graphed below is the CPI gasoline index only, which shows gas prices wild ride and recent increases. The summer is still predicted to have the cheapest gas since 2009.
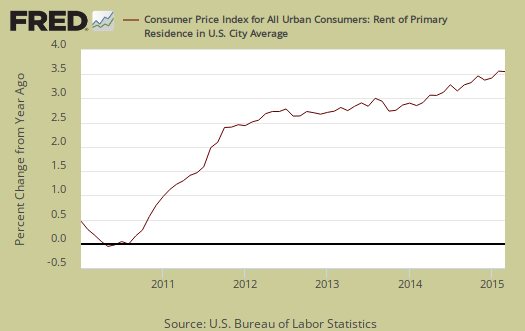
Core inflation's components include shelter, transportation, medical care and anything that is not food or energy. The shelter index is comprised of rent, the equivalent cost of owning a home, hotels and motels. Shelter increased 0.3% and is up 3.0% for the year%. Rent increased 0.3% for the month, 3.5% for the year. That's just outrageous as people simply cannot afford these soaring prices. The cost for home owners increased 2.7% for the past year. Graphed below is the rent price index.
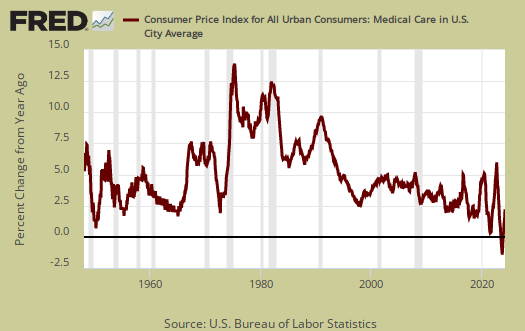
Medical care services is back on the rise and increased 0.4%. Graphed below is the overall medical care index change of 2.5% from a year ago.
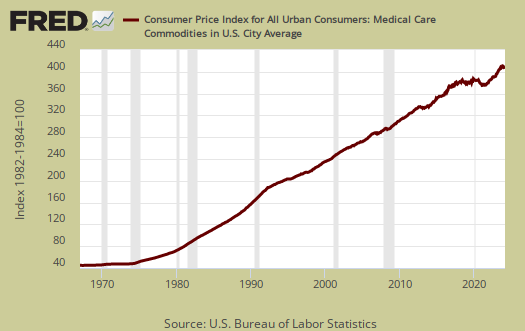
Below is a graph of the medical commodities index, which is mostly prescription drug prices. The index increased 0.1% for the month and is up 4.2% for the past year.
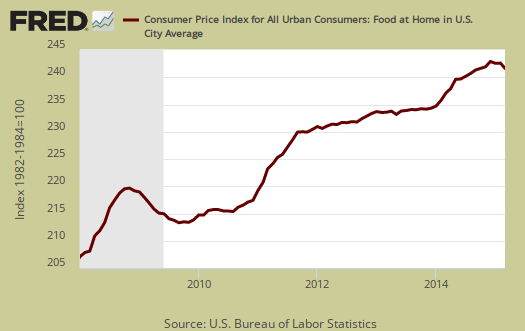
Food supposedly just got cheaper as the index dropped -0.2% for the month. Food and beverages have now increased 2.3% from a year ago. Groceries, (called food at home by BLS), plunged -0.5% for the month, and is up 1.9% for the year. Eating out, or food away from home increased 0.2% from last month and is up 2.9% from a year ago.
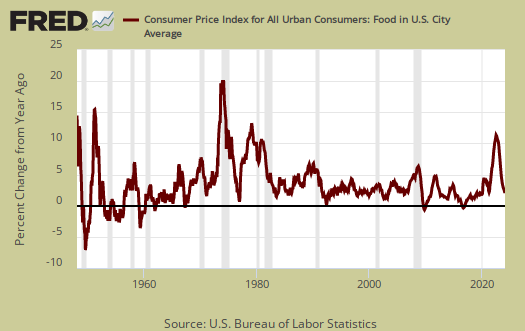
Graphed below are groceries, the food at home index. CPI is calculated using substitution, which claims consumers substitute hamburger for steak if prices rise on steak and somehow that's the same thing.
Individual food items so one gets a better feel for what is going on. Fruits and vegetables declined by -1.4% for the month and dairy declined -0.5% Beef & veal increased 0.1% and are up 13.1% for the year.
Real hourly earnings increased 0.1% for March for all employees. Real means wages adjusted for inflation. The average real wage is now $10.55 and has increased 2.2% from a year ago. Weekly real earnings have increased 2.2% for the year but are down -0.2% for the month.
CPI details
The DOL/BLS does take yearly surveys on where the money goes in the monthly budget, but as one can see, food and energy are significant amounts of the monthly finances. Run away costs in these two areas can break the bank, so can food. Additionally CPI uses substitution, so if flour goes through the roof, somehow we're all just fine with oats and prices didn't really overall increase much. Here is the BLS CPI site, where one can find much more details, information on calculation methods and error margins.
Other CPI report overviews, unrevised, although most graphs are updated, are here. If you're wondering why the graphs display different figures from the text, the graphs calculate percentages from the index and do not round. The actual data from the BLS report does round to one decimal place. In other words, 0.05% is rounded to 0.1%.
How do seniors fare with inflation?
So any savings from gasoline prices was eaten up by other price increases --- and why yearly inflation is now "flat".
What about a senior on Social Security (who doesn't benefit from driving a car) -- they would have seen their cost-of-living go up. So how will Social Security determine their next COLA?