The Mortgage Monitor for April (pdf) from Black Knight Financial Services (BKFS, formerly LPS) reported that there were 595,235 home mortgages, or 1.17% of all mortgages outstanding, remaining in the foreclosure process at the end of April, which was down from 630,766, or 1.25% of all active loans, that were in foreclosure at the end of March, and down from 1.63% of all mortgages that were in foreclosure in April of last year. These are homeowners who at least had a foreclosure notice served but whose homes had not yet been seized, and the April "foreclosure inventory" now represents the lowest percentage of homes that were in the foreclosure process since the summer of 2007. New foreclosure starts, which have been volatile from month to month, fell to 58,728 in April from 72,762 in March and from 70,400 in April a year ago. This was the lowest number of foreclosure starts in any month since April 2005, before the mortgage crisis began.
In addition to homes in foreclosure, BKFS data also showed that 2,145,589 mortgages, or 4.24% of all mortgage loans, were at least one mortgage payment overdue but not in foreclosure at the end of April, up from the 4.08% of homeowners with a mortgage who were more than 30 days behind in March, but down from the mortgage delinquency rate of 4.72% in April a year earlier. Of those who were delinquent in April, 730,179 home owners, or 1.45% of those with a mortgage, were more than 90 days behind on mortgage payments, but still not in foreclosure at the end of the month, which was down from 732,765 such "seriously delinquent" mortgages in March. Combining the total number of delinquent mortgages with those in foreclosure, we find that a total of 2,740,824 mortgage loans, or 5.41% of homeowners with a mortgage, were either late in paying or in foreclosure at the end of April, and that 1,325,141, or 2.62% of all homeowners, were in serious trouble, ie, either "seriously delinquent" or already in foreclosure at month end...
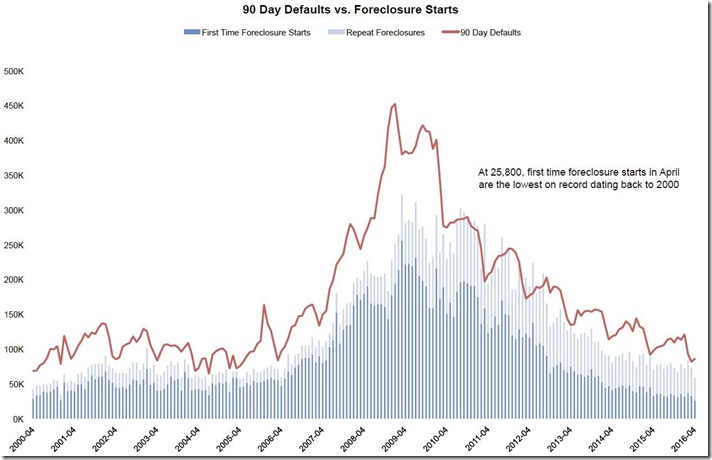
The graph below, from page 5 of the mortgage monitor pdf, shows the monthly historical counts of both foreclosure starts and of new 90 day delinquencies. The new 90 day delinquencies are tracked by the red line, with an obvious seasonal pattern wherein homeowners tend to fall behind on their mortgage payments as the holiday shopping season ensues, while the seasonal low for such serious defaults typically occurs in March. The number of monthly foreclosure starts are shown below in smoky blue bars, which are further divided into new first time foreclosures, shown as the darker portion of each bar, and repeat foreclosures shown in light blue, which are mortgages where the homeowner had been foreclosed on previously and either caught up on his payments or got a loan modification at that time, only to fall behind on payments another time and subsequently be foreclosed on again. Foreclosure starts usually hit their seasonal low in April, a month after the seasonal low for the 90 day defaults. And while it's fairly clear that total foreclosure starts in April were the lowest since April of 2005, if you look closelu you'll also notice that new foreclosure starts are the lowest on record, dating back to at least 2000...
For the details of the historical mortgage crisis metrics covered by the Mortgage Monitor, we're including below that part of the monthly table showing the monthly count of active home mortgage loans and their delinquency status, which comes from page 16 of the pdf. The columns in the table below show the total active mortgage loan count nationally for each month given, number of mortgages that were delinquent by more than 90 days but not yet in foreclosure, the monthly count of those mortgages that are in the foreclosure process (FC), the total non-current mortgages, including those that just missed one or two payments, and then the number of foreclosure starts for each month over the past 4 months and for each January shown going back to January 2005. In the last two columns, we see the average length of time that those who have been more than 90 days delinquent have remained in their homes without foreclosure, and then the average number of days those in foreclosure have been stuck in that process because of the lengthy foreclosure pipelines. With the slowdown in new foreclosures, the average length of delinquency for those who have been more than 90 days delinquent without foreclosure has now climbed back up to 520 days, but it’s is still short of the April 2015 record of 536 days, while the average time of delinquency for those who’ve been in foreclosure without a resolution has increased again and at 1088 days has again topped the record set last month. That means that the average homeowner who is in foreclosure now has been there roughly three years, which, considering that this year's new foreclosure starts were all less than 120 days old, suggests that many foreclosures started early in the crisis are still not yet completed…
(note: the above was excerpted from my weekly post on Marketwatch 6666)


amazing foreclosure times
Is that longer than the length of home ownership?
three years
could be..i had been expecting that to reverse when it slowed down in 2015 but this year it looks like it's getting worse every month...
rjs