
We have already seen that real personal consumption expenditures so far this quarter are suggesting a weak 3rd quarter GDP print. The August Advance Report on Durable Goods Manufacturers’ Shipments, Inventories and Orders (pdf) from the Census Bureau also may give us some further insight into the direction of the 3rd quarter GDP, as its data inputs into equipment investment, consumer durable goods spending, government and military spending, inventories and exports. While most reported that new orders were up slightly in August, as they rose 0.1%, few made note of the fact that July durable goods orders, which we previously reported showed a widespread contraction while shrinking 7.3% in July, were revised down to an even greater 8.1% decrease. While that does not bode well for the future, new orders are notoriously noisy, so we'll also look at shipments and inventories with an eye to their impact on the current quarter...
Seasonally adjusted new orders for manufactured durable goods increased $0.3 billion in August to $224.9 billion, which as we've already mentioned was a 0.1% increase from July's depressed level. That means that August orders were still 8.0% below the new orders rate of $244.4 billion that we saw in June. There was a 0.7% increase to $67,909 million in new orders for transportation equipment, led by a 2.4% jump in new orders for vehicles and parts; however, that came on the heals of a 21.9% decrease in orders for transportation goods, as June transport orders came in at $86,387. New orders less transports, a popular metric which strips out volatile aircraft orders, were down 0.1% in August after a revised 0.5% decrease in July. New orders for defense aircraft, another volatile category, were down 11.8% after being down 3.1% in July; however they just account for $4,479 million on the books, less than 2% of the total. But there's not much volatility in new orders for computers and electronic equipment, which were down 3.4% in August after being down 2.4% in July; their new orders have now shrunk to $20,775 million from $22,069 million in June. But it's new orders for capital goods where the real weakness lies, down another 0.8% after being down 18.1% in July, which means new orders for capital goods at $84,285 million are now running nearly 19% below the June level of $103,795 million.. Even stripping out defense capital goods and aircraft, orders for so called core capital goods were at $68,379 in August, 1.9% below the June core capital goods orders of $69,695. Were it not for new orders for new cars, new orders for durable goods would be a real train wreck.
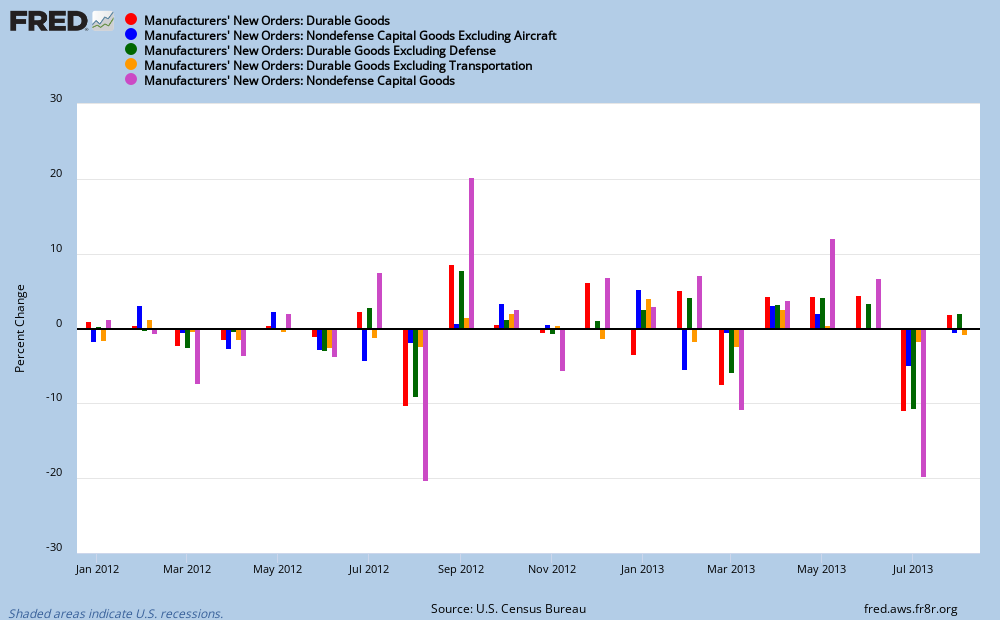
Our FRED bar graph below shows the month to month change of several of these durable goods categories, beginning in January of 2012. In each month, the red bar indicates the percentage change in overall new orders for durable goods for that month. Next in each month, the blue bar indicates the percentage change for all orders for durable goods except aircraft and defense; followed by a bar in green which shows the change in new orders ex-defense; while in orange, we have a special consumer durables category, new orders for consumer durables ex transportation. Finally, in violet, we have the change in new orders for all non-defense capital goods including aircraft, which is a fair proxy for what would be included in the equipment investment category of GDP. On that graph, the August / September 2012 change shows what should have happened if the monthly change was just from abnormally volatile orders; after the downturn comes a rebound.. But after the downturn in July this year, new orders in August didn't do squat..
As bad as new orders were, it's the value of shipments of durable goods over July, August and September that will more closely impact third quarter GDP than new orders, which in many cases have lead times in months. Overall, August seasonally adjusted shipments of manufactured durable goods increased $2.1 billion to $231.466 billion, which is a 0.9% increase over total July shipments of $229.353 billion, which was down 0.1% from June's level of $229,600.. Shipments of transportation equipment, up 1.5% in August to $69,738 million, led the increase, with shipments of motor vehicles up 1.9% driving that increase, as shipments of non-defense aircraft fell 5.1%.. Shipments of machinery were up 0.4% to $33,705 million after falling 1.5% in July, and shipments of computers and electronic equipment rose 1.3% in August to $27,576 million after a 1.1% contraction in July. Overall shipments of capital goods also partially rebounded from a 1.9% pullback in July, as they rose 1.3% in August to $83,941 million; of that, shipments of non-defense capital goods rose 0.4% to $73,808 million after falling 1.4% in July.
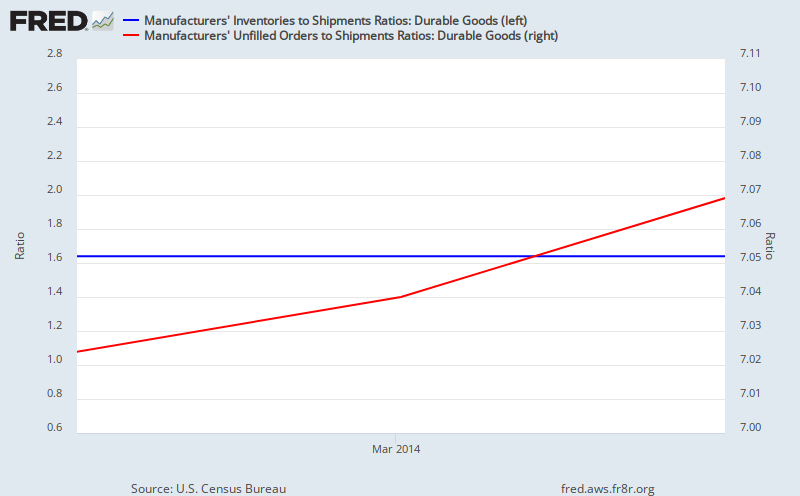
Seasonally adjusted inventories of durable goods were up 0.1% in August to a new record high of $379,084 million, which in turn followed the 0.3% increase in July. Inventories of transportation equipment, up 0.3% and valued at $117,280 million, again led the increase, as transportation equipment inventories were also up 0.6% in July. Inventories of motor vehicles increased 0.7% and inventories of non-defense aircraft were up 1.3%, while military aircraft and parts inventories fell 3.6%.. Excluding transportation inventories, all other inventories were virtually unchanged, as they fell by less than 0.1%. Inventories of computers and electronic equipment were down 0.6% to $46,374 million, although inventories of communication gear rose 1.3%. Inventories of electrical equipment, appliances, and components rose 0.5% after being up 0.2% in July, and overall capital goods inventories increased 0.1% as well, to $194,624 million, after increasing 0.3% in July.. Our FRED graph below shows the ratio of durable goods inventories to shipments in blue with the scale on the left, and the ratio of inventories to unfilled durable goods orders in red with the scale on the left. Concerns that there has been an excessive build of inventories appear unfounded, at least for durable goods…
(cross posted at MarketWatch 666)
Comments
thanks for posting this
Good info, graphs could benefit from larger fonts.
Thanks for posting. :-)
graphs
click on any graph you're having trouble viewing; all my graphs are linked to a larger version
rjs